Electronic Arts 2015 Annual Report Download - page 158
Download and view the complete annual report
Please find page 158 of the 2015 Electronic Arts annual report below. You can navigate through the pages in the report by either clicking on the pages listed below, or by using the keyword search tool below to find specific information within the annual report.-
 1
1 -
2
-
3
-
4
-
5
-
6
-
7
-
8
-
9
-
10
-
11
-
12
-
13
-
14
-
15
-
16
-
17
-
18
-
19
-
20
-
21
-
22
-
23
-
24
-
25
-
26
-
27
-
28
-
29
-
30
-
31
-
32
-
33
-
34
-
35
-
36
-
37
-
38
-
39
-
40
-
41
-
42
-
43
-
44
-
45
-
46
-
47
-
48
-
49
-
50
-
51
-
52
-
53
-
54
-
55
-
56
-
57
-
58
-
59
-
60
-
61
-
62
-
63
-
64
-
65
-
66
-
67
-
68
-
69
-
70
-
71
-
72
-
73
-
74
-
75
-
76
-
77
-
78
-
79
-
80
-
81
-
82
-
83
-
84
-
85
-
86
-
87
-
88
-
89
-
90
-
91
-
92
-
93
-
94
-
95
-
96
-
97
-
98
-
99
-
100
-
101
-
102
-
103
-
104
-
105
-
106
-
107
-
108
-
109
-
110
-
111
-
112
-
113
-
114
-
115
-
116
-
117
-
118
-
119
-
120
-
121
-
122
-
123
-
124
-
125
-
126
-
127
-
128
-
129
-
130
-
131
-
132
-
133
-
134
-
135
-
136
-
137
-
138
-
139
-
140
-
141
-
142
-
143
-
144
-
145
-
146
-
147
-
 148
148 -
 149
149 -
 150
150 -
 151
151 -
 152
152 -
 153
153 -
 154
154 -
 155
155 -
 156
156 -
 157
157 -
 158
158 -
 159
159 -
 160
160 -
 161
161 -
 162
162 -
 163
163 -
 164
164 -
 165
165 -
 166
166 -
 167
167 -
 168
168 -
169
-
170
-
171
-
172
-
173
-
174
-
175
-
176
-
177
-
178
-
179
-
180
 |
 |

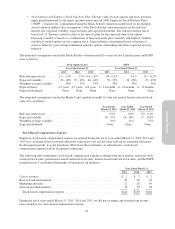
As of March 31, 2015, our total unrecognized compensation cost related to stock options was $16 million and is
expected to be recognized over a weighted-average service period of 2.2 years. As of March 31, 2015, our total
unrecognized compensation cost related to restricted stock and restricted stock units (collectively referred to as
“restricted stock rights”) was $222 million and is expected to be recognized over a weighted-average service
period of 1.3 years. Of the $222 million of unrecognized compensation cost, $12 million relates to market-based
restricted stock units.
For fiscal years ended March 31, 2015 and 2014, we recognized $22 million and $13 million, respectively, of
excess tax benefit from stock-based compensation deductions; this amount is reported in the financing activities
on our Consolidated Statement of Cash Flows. For the fiscal year ended March 31, 2013, we recognized $1
million of tax expense from stock-based compensation, net of $1 million of deferred tax write-offs. There was no
excess tax benefit related to stock-based compensation deductions reported in the financing activities on our
Consolidated Statements of Cash Flows during the fiscal year ended March 31, 2013.
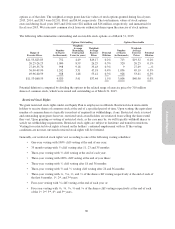
Summary of Plans and Plan Activity
Equity Incentive Plans
Our 2000 Equity Incentive Plan (the “Equity Plan”) allows us to grant options to purchase our common stock and
to grant restricted stock, restricted stock units and stock appreciation rights to our employees, officers and
directors. Pursuant to the Equity Plan, incentive stock options may be granted to employees and officers and non-
qualified options may be granted to employees, officers and directors, at not less than 100 percent of the fair
market value on the date of grant.
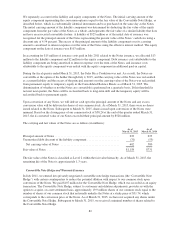
A total of 19.2 million options or 13.4 million restricted stock units were available for grant under our Equity
Plan as of March 31, 2015.
Stock Options
Options granted under the Equity Plan generally expire ten years from the date of grant and generally vest
according to one of the following schedules:
• 35 month vesting with
1
⁄
3
cliff vesting after 11, 23 and 35 months or;
• 50 month vesting with 24% of the shares cliff vesting after 12 months and the ratably over the
following 38 months.
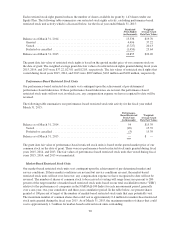
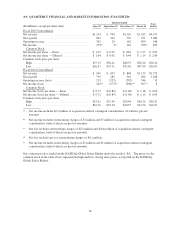
The following table summarizes our stock option activity for the fiscal year ended March 31, 2015:
Options
(in thousands)
Weighted-
Average
Exercise Prices
Weighted-
Average
Remaining
Contractual
Term (in years)
Aggregate
Intrinsic Value
(in millions)
Outstanding as of March 31, 2014 .............. 5,311 $37.43
Granted ................................. 1,248 35.79
Exercised ................................ (1,021) 23.76
Forfeited, cancelled or expired ............... (618) 56.66
Outstanding as of March 31, 2015 .............. 4,920 $37.44 5.41 $102
Vested and expected to vest ................... 4,612 $37.82 5.17 $ 94
Exercisable as of March 31, 2015 ............... 3,006 $40.90 3.14 $ 52
The aggregate intrinsic value represents the total pre-tax intrinsic value based on our closing stock price as of
March 31, 2015, which would have been received by the option holders had all the option holders exercised their
88