Electronic Arts 2015 Annual Report Download - page 96
Download and view the complete annual report
Please find page 96 of the 2015 Electronic Arts annual report below. You can navigate through the pages in the report by either clicking on the pages listed below, or by using the keyword search tool below to find specific information within the annual report.-
 1
1 -
2
-
3
-
4
-
5
-
6
-
7
-
8
-
9
-
10
-
11
-
12
-
13
-
14
-
15
-
16
-
17
-
18
-
19
-
20
-
21
-
22
-
23
-
24
-
25
-
26
-
27
-
28
-
29
-
30
-
31
-
32
-
33
-
34
-
35
-
36
-
37
-
38
-
39
-
40
-
41
-
42
-
43
-
44
-
45
-
46
-
47
-
48
-
49
-
50
-
51
-
52
-
53
-
54
-
55
-
56
-
57
-
58
-
59
-
60
-
61
-
62
-
63
-
64
-
65
-
66
-
67
-
68
-
69
-
70
-
71
-
72
-
73
-
74
-
75
-
76
-
77
-
78
-
79
-
80
-
81
-
82
-
83
-
84
-
85
-
 86
86 -
 87
87 -
 88
88 -
 89
89 -
 90
90 -
 91
91 -
 92
92 -
 93
93 -
 94
94 -
 95
95 -
 96
96 -
 97
97 -
 98
98 -
 99
99 -
 100
100 -
 101
101 -
 102
102 -
 103
103 -
 104
104 -
 105
105 -
 106
106 -
107
-
108
-
109
-
110
-
111
-
112
-
113
-
114
-
115
-
116
-
117
-
118
-
119
-
120
-
121
-
122
-
123
-
124
-
125
-
126
-
127
-
128
-
129
-
130
-
131
-
132
-
133
-
134
-
135
-
136
-
137
-
138
-
139
-
140
-
141
-
142
-
143
-
144
-
145
-
146
-
147
-
148
-
149
-
150
-
151
-
152
-
153
-
154
-
155
-
156
-
157
-
158
-
159
-
160
-
161
-
162
-
163
-
164
-
165
-
166
-
167
-
168
-
169
-
170
-
171
-
172
-
173
-
174
-
175
-
176
-
177
-
178
-
179
-
180
 |
 |

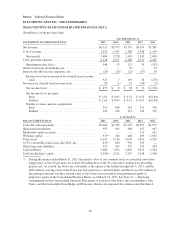
Item 6: Selected Financial Data
ELECTRONIC ARTS INC. AND SUBSIDIARIES
SELECTED FIVE-YEAR CONSOLIDATED FINANCIAL DATA
(In millions, except per share data)
Year Ended March 31,
STATEMENTS OF OPERATIONS DATA 2015 2014 2013 2012 2011
Net revenue ....................................... $4,515 $3,575 $3,797 $4,143 $3,589
Cost of revenue .................................... 1,429 1,347 1,388 1,598 1,499
Gross profit ..................................... 3,086 2,228 2,409 2,545 2,090
Total operating expenses ............................. 2,138 2,195 2,288 2,510 2,402
Operating income (loss) ........................... 948 33 121 35 (312)
Gains on strategic investments, net ..................... — — 39 — 23
Interest and other income (expense), net ................. (23) (26) (21) (17) 10
Income (loss) before provision for (benefit from) income
taxes ......................................... 925 7 139 18 (279)
Provision for (benefit from) income taxes ............... 50 (1) 41 (58) (3)
Net income (loss) ................................ $ 875 $ 8 $ 98 $ 76 $ (276)
Net income (loss) per share:
Basic ........................................ $ 2.81 $ 0.03 $ 0.32 $ 0.23 $ (0.84)
Diluted ....................................... $ 2.69 $ 0.03 $ 0.31 $ 0.23 $ (0.84)
Number of shares used in computation:
Basic ........................................ 311 308 310 331 330
Diluted ....................................... 325 316 313 336 330
As of March 31,
BALANCE SHEETS DATA 2015 2014 2013 2012 2011
Cash and cash equivalents ............................ $2,068 $1,782 $1,292 $1,293 $1,579
Short-term investments .............................. 953 583 388 437 497
Marketable equity securities .......................... — — — 119 161
Working capital .................................... 973
(a) 748 408 489 1,031
Total assets ....................................... 6,147 5,716 5,070 5,491 4,928
0.75% convertible senior notes due 2016, net ............. 633
(a) 580 559 539 —
Other long-term liabilities ............................ 333 324 327 374 363
Total liabilities .................................... 3,080 3,294 2,803 3,033 2,364
Total stockholders’ equity ............................ 3,036(a) 2,422 2,267 2,458 2,564
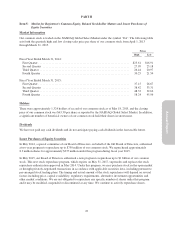
(a) During the quarter ended March 31, 2015, the market value of our common stock exceeded the conversion
trigger price of $41.26 per share for at least 20 trading days of the 30 consecutive trading days preceding
quarter end. As a result, the Notes are convertible at the option of the holder through July 4, 2015, and the
$602 million carrying value of the Notes was reclassified as a current liability and the excess $31 million of
the principal amount over the carrying value of the Notes was reclassified from permanent equity to
temporary equity in the Consolidated Balance Sheets as of March 31, 2015. See Note 12 — Financing
Arrangements to the Consolidated Financial Statements as it relates to the Notes, the convertibility of the
Notes, and the Convertible Note Hedge and Warrants, which is incorporated by reference into this Item 6.
26