Electronic Arts 2015 Annual Report Download - page 160
Download and view the complete annual report
Please find page 160 of the 2015 Electronic Arts annual report below. You can navigate through the pages in the report by either clicking on the pages listed below, or by using the keyword search tool below to find specific information within the annual report.-
 1
1 -
2
-
3
-
4
-
5
-
6
-
7
-
8
-
9
-
10
-
11
-
12
-
13
-
14
-
15
-
16
-
17
-
18
-
19
-
20
-
21
-
22
-
23
-
24
-
25
-
26
-
27
-
28
-
29
-
30
-
31
-
32
-
33
-
34
-
35
-
36
-
37
-
38
-
39
-
40
-
41
-
42
-
43
-
44
-
45
-
46
-
47
-
48
-
49
-
50
-
51
-
52
-
53
-
54
-
55
-
56
-
57
-
58
-
59
-
60
-
61
-
62
-
63
-
64
-
65
-
66
-
67
-
68
-
69
-
70
-
71
-
72
-
73
-
74
-
75
-
76
-
77
-
78
-
79
-
80
-
81
-
82
-
83
-
84
-
85
-
86
-
87
-
88
-
89
-
90
-
91
-
92
-
93
-
94
-
95
-
96
-
97
-
98
-
99
-
100
-
101
-
102
-
103
-
104
-
105
-
106
-
107
-
108
-
109
-
110
-
111
-
112
-
113
-
114
-
115
-
116
-
117
-
118
-
119
-
120
-
121
-
122
-
123
-
124
-
125
-
126
-
127
-
128
-
129
-
130
-
131
-
132
-
133
-
134
-
135
-
136
-
137
-
138
-
139
-
140
-
141
-
142
-
143
-
144
-
145
-
146
-
147
-
148
-
149
-
 150
150 -
 151
151 -
 152
152 -
 153
153 -
 154
154 -
 155
155 -
 156
156 -
 157
157 -
 158
158 -
 159
159 -
 160
160 -
 161
161 -
 162
162 -
 163
163 -
 164
164 -
 165
165 -
 166
166 -
 167
167 -
 168
168 -
 169
169 -
 170
170 -
171
-
172
-
173
-
174
-
175
-
176
-
177
-
178
-
179
-
180
 |
 |

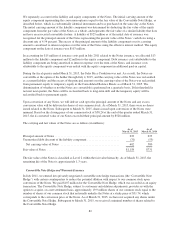
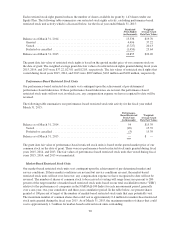
Each restricted stock right granted reduces the number of shares available for grant by 1.43 shares under our
Equity Plan. The following table summarizes our restricted stock rights activity, excluding performance-based
restricted stock unit activity which is discussed below, for the fiscal year ended March 31, 2015:
Restricted
Stock Rights
(in thousands)
Weighted-
Average Grant
Date Fair Values
Balance as of March 31, 2014 ......................................... 13,536 $19.70
Granted ......................................................... 4,496 37.22
Vested .......................................................... (5,727) 20.13
Forfeited or cancelled .............................................. (1,450) 23.64
Balance as of March 31, 2015 ......................................... 10,855 $26.20
The grant date fair value of restricted stock rights is based on the quoted market price of our common stock on
the date of grant. The weighted-average grant date fair values of restricted stock rights granted during fiscal years
2015, 2014, and 2013 were $37.22, $23.01 and $12.85, respectively. The fair values of restricted stock rights that
vested during fiscal years 2015, 2014, and 2013 were $209 million, $163 million and $102 million, respectively.
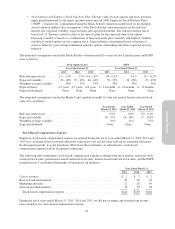
Performance-Based Restricted Stock Units
Our performance-based restricted stock units vest contingent upon the achievement of pre-determined
performance-based milestones. If these performance-based milestones are not met, the performance-based
restricted stock units will not vest, in which case, any compensation expense we have recognized to date will be
reversed.
The following table summarizes our performance-based restricted stock unit activity for the fiscal year ended
March 31, 2015:
Performance-
Based Restricted
Stock Units
(in thousands)
Weighted-
Average Grant
Date Fair Values
Balance as of March 31, 2014 ........................................ 54 $15.39
Vested ........................................................ (49) 15.39
Forfeited or cancelled ............................................ (5) 15.39
Balance as of March 31, 2015 ........................................ — $ —
The grant date fair value of performance-based restricted stock units is based on the quoted market price of our
common stock on the date of grant. There were no performance-based restricted stock units granted during fiscal
years 2015, 2014, and 2013. The fair values of performance-based restricted stock units that vested during fiscal
years 2015, 2014, and 2013 was immaterial.
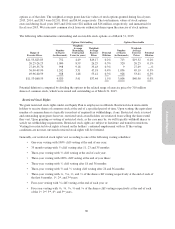
Market-Based Restricted Stock Units
Our market-based restricted stock units vest contingent upon the achievement of pre-determined market and
service conditions. If these market conditions are not met but service conditions are met, the market-based
restricted stock units will not vest; however, any compensation expense we have recognized to date will not be
reversed. The number of shares of common stock to be received at vesting will range from zero percent to 200
percent of the target number of market-based restricted stock units based on our total stockholder return (“TSR”)
relative to the performance of companies in the NASDAQ-100 Index for each measurement period, generally
over a one-year, two-year cumulative and three-year cumulative period. In the table below, we present shares
granted at 100 percent of target of the number of market-based restricted stock units that may potentially vest.
The maximum number of common shares that could vest is approximately 0.4 million for market-based restricted
stock units granted during the fiscal year 2015. As of March 31, 2015, the maximum number of shares that could
vest is approximately 1.3 million for market-based restricted stock units outstanding.
90