Electronic Arts 2015 Annual Report Download - page 46
Download and view the complete annual report
Please find page 46 of the 2015 Electronic Arts annual report below. You can navigate through the pages in the report by either clicking on the pages listed below, or by using the keyword search tool below to find specific information within the annual report.-
 1
1 -
2
-
3
-
4
-
5
-
6
-
7
-
8
-
9
-
10
-
11
-
12
-
13
-
14
-
15
-
16
-
17
-
18
-
19
-
20
-
21
-
22
-
23
-
24
-
25
-
26
-
27
-
28
-
29
-
30
-
31
-
32
-
33
-
34
-
35
-
 36
36 -
 37
37 -
 38
38 -
 39
39 -
 40
40 -
 41
41 -
 42
42 -
 43
43 -
 44
44 -
 45
45 -
 46
46 -
 47
47 -
 48
48 -
 49
49 -
 50
50 -
 51
51 -
 52
52 -
 53
53 -
 54
54 -
 55
55 -
 56
56 -
57
-
58
-
59
-
60
-
61
-
62
-
63
-
64
-
65
-
66
-
67
-
68
-
69
-
70
-
71
-
72
-
73
-
74
-
75
-
76
-
77
-
78
-
79
-
80
-
81
-
82
-
83
-
84
-
85
-
86
-
87
-
88
-
89
-
90
-
91
-
92
-
93
-
94
-
95
-
96
-
97
-
98
-
99
-
100
-
101
-
102
-
103
-
104
-
105
-
106
-
107
-
108
-
109
-
110
-
111
-
112
-
113
-
114
-
115
-
116
-
117
-
118
-
119
-
120
-
121
-
122
-
123
-
124
-
125
-
126
-
127
-
128
-
129
-
130
-
131
-
132
-
133
-
134
-
135
-
136
-
137
-
138
-
139
-
140
-
141
-
142
-
143
-
144
-
145
-
146
-
147
-
148
-
149
-
150
-
151
-
152
-
153
-
154
-
155
-
156
-
157
-
158
-
159
-
160
-
161
-
162
-
163
-
164
-
165
-
166
-
167
-
168
-
169
-
170
-
171
-
172
-
173
-
174
-
175
-
176
-
177
-
178
-
179
-
180
 |
 |

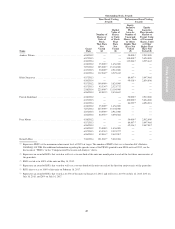
(4)
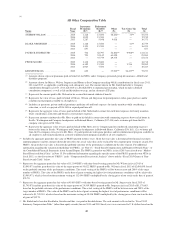
All Other Compensation Table
Name
Fiscal
Year
Insurance
Premiums
($)(A)
Retirement
Benefits
($)(B)
Other
($)
Tax Gross-Up
($)
Total
($)
ANDREW WILSON ................ 2015 1,118 15,600 38,462(C) 75(D) 55,255
2014 1,919 15,300 — — 17,219
2013 1,287 5,048 4,038 — 10,373
BLAKE JORGENSEN ............... 2015 1,118 15,600 — 41(D) 16,759
2014 1,124 15,300 — — 16,424
2013 657 — — — 657
PATRICK SÖDERLUND ............ 2015 702 68,797 62,204(E) 9,908(F) 141,611
2014 791 32,142 63,050 — 95,983
2013 — 37,779 29,375 — 67,154
PETER MOORE .................... 2015 1,118 15,600 — — 16,718
2014 6,149 15,300 — 3,516 24,965
2013 2,943 7,500 — — 10,443
KENNETH MOSS .................. 2015 839 — 37,923(G) 36,475(H) 75,237
(A) Amounts shown represent premiums paid on behalf of our NEOs under Company sponsored group life insurance, AD&D and
disability programs.
(B) Amounts shown for Messrs. Wilson, Jorgensen and Moore reflect Company-matching 401(k) contributions for fiscal years 2013,
2014 and 2015, as applicable, paid during each subsequent year. The amount shown for Mr. Söderlund reflects Company
contributions during fiscal 2013, 2014 and 2015 to a Swedish ITP2 occupational pension plan, which includes a defined
contribution component, as well as life and disability coverage, and an alternative ITP plan.
(C) Represents the amount paid to Mr. Wilson for his accrued but unused sabbatical benefit.
(D) Represents the value of taxes paid on behalf of Messrs. Wilson and Jorgensen for participation in video game purchase and/or
reimbursement program available to all employees.
(E) Includes car payments, private medical premiums, paid time off and hotel expenses for family members while considering a
relocation, as well as a payout of $36,381 for expired paid time off.
(F) Represents the aggregate value of taxes paid on behalf of Mr. Söderlund in connection with hotel expenses for family members
while considering a relocation and business entertainment expenses.
(G) Represents amounts reimbursed to Mr. Moss or paid on his behalf in connection with commuting expenses between his home in
Seattle, Washington and Company headquarters in Redwood Shores, California ($37,438) and a welcome gift from the EA
company store given to Mr. Moss.
(H) Represents the aggregate value of taxes paid on behalf of Mr. Moss for (1) Company paid or reimbursed commuting expenses
between his home in Seattle, Washington and Company headquarters in Redwood Shores, California ($36,183), (2) a welcome gift
from the EA company store given to Mr. Moss, (3) participation in video game purchase and/or reimbursement program available to
all employees and (4) participation in a console reimbursement program available to all new employees.
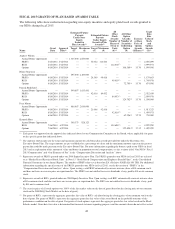
(5) Includes the aggregate grant date fair value of PRSUs granted in those years. Grant date fair value is determined for financial statement
reporting purposes and the amounts shown do not reflect the actual value that can be realized by the recipient upon vesting of awards. For
PRSUs, the grant date fair value is based on the probable outcome of the performance condition on the date of grant. For additional
information regarding the valuation methodology for PRSUs, see Note 15, “Stock-Based Compensation and Employee Benefit Plans”, to
the Consolidated Financial Statements in our Annual Report. The PRSUs granted to our NEOs in fiscal 2015 are referred to as “Market-
Based Restricted Stock Units” in Note 15. For additional information regarding the specific terms of the PRSUs granted to our NEOs in
fiscal 2015, see the discussion of “PRSUs” in the “Compensation Discussion & Analysis” above and the “Fiscal 2015 Grants of Plan-
Based Awards Table” below.
(6) Represents the aggregate grant date fair value of 112,044 RSUs with time-based vesting granted to Mr. Wilson in fiscal 2015 of
$3,999,971 and the grant date fair value of the target payout of 56,022 PRSUs granted to Mr. Wilson in fiscal 2015 of $2,696,899, based
on the probable outcome of the performance conditions. The actual vesting of the PRSUs will be between zero and 200% of the target
number of PRSUs. The value of the PRSUs on the date of grant assuming the highest level of performance conditions will be achieved is
$3,999,971, which is based on the maximum vesting of 112,044 PRSUs multiplied by the closing price of our stock on the date of grant of
$35.70.
(7) Represents the aggregate grant date fair value of 49,019 RSUs with time-based vesting granted to Mr. Jorgensen in fiscal 2015 of
$1,749,978 and the grant date fair value of the target payout of 24,509 PRSUs granted to Mr. Jorgensen in fiscal 2015 of $1,179,863,
based on the probable outcome of the performance conditions. The actual vesting of the PRSUs will be between zero and 200% of the
target number of PRSUs. The value of the PRSUs on the date of grant assuming the highest level of performance conditions will be
achieved is $1,749,943, which is based on the maximum vesting of 49,018 PRSUs multiplied by the closing price of our stock on the date
of grant of $35.70.
(8) Mr. Söderlund is based in Stockholm, Sweden and thus, was paid in Swedish krona. The cash amounts reflected in the “Fiscal 2015
Summary Compensation Table” (other than equity awards) for our 2013 and 2014 fiscal years were converted to U.S. dollars based on the
40