Electronic Arts 2015 Annual Report Download - page 110
Download and view the complete annual report
Please find page 110 of the 2015 Electronic Arts annual report below. You can navigate through the pages in the report by either clicking on the pages listed below, or by using the keyword search tool below to find specific information within the annual report.-
 1
1 -
2
-
3
-
4
-
5
-
6
-
7
-
8
-
9
-
10
-
11
-
12
-
13
-
14
-
15
-
16
-
17
-
18
-
19
-
20
-
21
-
22
-
23
-
24
-
25
-
26
-
27
-
28
-
29
-
30
-
31
-
32
-
33
-
34
-
35
-
36
-
37
-
38
-
39
-
40
-
41
-
42
-
43
-
44
-
45
-
46
-
47
-
48
-
49
-
50
-
51
-
52
-
53
-
54
-
55
-
56
-
57
-
58
-
59
-
60
-
61
-
62
-
63
-
64
-
65
-
66
-
67
-
68
-
69
-
70
-
71
-
72
-
73
-
74
-
75
-
76
-
77
-
78
-
79
-
80
-
81
-
82
-
83
-
84
-
85
-
86
-
87
-
88
-
89
-
90
-
91
-
92
-
93
-
94
-
95
-
96
-
97
-
98
-
99
-
 100
100 -
 101
101 -
 102
102 -
 103
103 -
 104
104 -
 105
105 -
 106
106 -
 107
107 -
 108
108 -
 109
109 -
 110
110 -
 111
111 -
 112
112 -
 113
113 -
 114
114 -
 115
115 -
 116
116 -
 117
117 -
 118
118 -
 119
119 -
 120
120 -
121
-
122
-
123
-
124
-
125
-
126
-
127
-
128
-
129
-
130
-
131
-
132
-
133
-
134
-
135
-
136
-
137
-
138
-
139
-
140
-
141
-
142
-
143
-
144
-
145
-
146
-
147
-
148
-
149
-
150
-
151
-
152
-
153
-
154
-
155
-
156
-
157
-
158
-
159
-
160
-
161
-
162
-
163
-
164
-
165
-
166
-
167
-
168
-
169
-
170
-
171
-
172
-
173
-
174
-
175
-
176
-
177
-
178
-
179
-
180
 |
 |

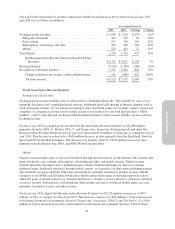
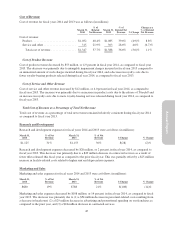
Team and Madden Ultimate Team, (3) a $104 million or 40 percent increase in subscription sales primarily
driven by Battlefield 4 Premium, and (4) a $72 million or 16 percent increase in mobile revenue primarily driven
by Madden NFL Mobile,Simcity BuildIt,FIFA 15 Mobile, and FIFA Online 3.
Revenue Deferral
Revenue Deferral for fiscal year 2015 increased $186 million, or 6 percent, as compared to fiscal year 2014. This
increase was primarily due to a $298 million increase in Net Revenue before Revenue Deferral related to our
packaged goods and other and digital sales during fiscal year 2015 as compared to fiscal year 2014.
Recognition of Revenue Deferral
The Recognition of Revenue Deferral for fiscal year 2015 increased $828 million, or 29 percent, as compared to
fiscal year 2014. This increase was primarily due to (1) the increase in our estimated offering period from six to
nine months, which was implemented during the second quarter of fiscal year 2014 for packaged goods sold
through retail, and (2) an increase in digital and packaged goods sales during the preceding six and nine-month
period. The change in estimated offering period resulted in an estimated increase to net revenue and net income
of $474 million and an increase of $1.46 of diluted earnings per share for the fiscal year ended March 31, 2015.
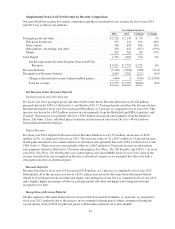
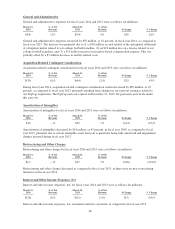
Cost of Revenue
Cost of revenue for fiscal years 2015 and 2014 was as follows (in millions):
March 31,
2015
%of
Related Net
Revenue
March 31,
2014
%of
Related Net
Revenue
%
Change
Change as a
% of Related
Net Revenue
Cost of revenue:
Product .......................... $1,028 40.0% $1,032 48.4% (0.4)% (8.4)%
Service and other .................. 401 20.6% 315 21.9% 27.3% (1.3)%
Total cost of revenue ............. $1,429 31.7% $1,347 37.7% 6.1% (6.0)%
Cost of Product Revenue
Cost of product revenue consists of (1) product costs, (2) certain royalty expenses for celebrities, professional
sports and other organizations, and independent software developers, (3) manufacturing royalties, net of volume
discounts and other vendor reimbursements, (4) expenses for defective products, (5) write-offs of post-launch
prepaid royalty costs and losses on previously unrecognized licensed intellectual property commitments,
(6) amortization of certain intangible assets, (7) personnel-related costs, and (8) warehousing and distribution
costs. We generally recognize volume discounts when they are earned from the manufacturer (typically in
connection with the achievement of unit-based milestones); whereas other vendor reimbursements are generally
recognized as the related revenue is recognized.
Cost of product revenue decreased by $4 million, or 0.4 percent in fiscal year 2015, as compared to fiscal year
2014. Cost of product revenue decreased primarily due to an increase in net revenue before revenue deferral from
our digital product sales that generally have lower costs than our packaged goods and other product sales during
fiscal year 2015, as compared to the fiscal year 2014, partially offset by a loss of $122 million on a previously
unrecognized licensed intellectual property commitment recognized during the three months ended June 30,
2014.
Cost of Service and Other Revenue
Cost of service and other revenue consists primarily of (1) royalty costs, (2) data center, bandwidth and server
costs associated with hosting our online games and websites, (3) platform processing fees from operating our
website-based games on third party platforms, and (4) credit card fees associated with our service revenue.
40