Electronic Arts 2015 Annual Report Download - page 116
Download and view the complete annual report
Please find page 116 of the 2015 Electronic Arts annual report below. You can navigate through the pages in the report by either clicking on the pages listed below, or by using the keyword search tool below to find specific information within the annual report.-
 1
1 -
2
-
3
-
4
-
5
-
6
-
7
-
8
-
9
-
10
-
11
-
12
-
13
-
14
-
15
-
16
-
17
-
18
-
19
-
20
-
21
-
22
-
23
-
24
-
25
-
26
-
27
-
28
-
29
-
30
-
31
-
32
-
33
-
34
-
35
-
36
-
37
-
38
-
39
-
40
-
41
-
42
-
43
-
44
-
45
-
46
-
47
-
48
-
49
-
50
-
51
-
52
-
53
-
54
-
55
-
56
-
57
-
58
-
59
-
60
-
61
-
62
-
63
-
64
-
65
-
66
-
67
-
68
-
69
-
70
-
71
-
72
-
73
-
74
-
75
-
76
-
77
-
78
-
79
-
80
-
81
-
82
-
83
-
84
-
85
-
86
-
87
-
88
-
89
-
90
-
91
-
92
-
93
-
94
-
95
-
96
-
97
-
98
-
99
-
100
-
101
-
102
-
103
-
104
-
105
-
 106
106 -
 107
107 -
 108
108 -
 109
109 -
 110
110 -
 111
111 -
 112
112 -
 113
113 -
 114
114 -
 115
115 -
 116
116 -
 117
117 -
 118
118 -
 119
119 -
 120
120 -
 121
121 -
 122
122 -
 123
123 -
 124
124 -
 125
125 -
 126
126 -
127
-
128
-
129
-
130
-
131
-
132
-
133
-
134
-
135
-
136
-
137
-
138
-
139
-
140
-
141
-
142
-
143
-
144
-
145
-
146
-
147
-
148
-
149
-
150
-
151
-
152
-
153
-
154
-
155
-
156
-
157
-
158
-
159
-
160
-
161
-
162
-
163
-
164
-
165
-
166
-
167
-
168
-
169
-
170
-
171
-
172
-
173
-
174
-
175
-
176
-
177
-
178
-
179
-
180
 |
 |

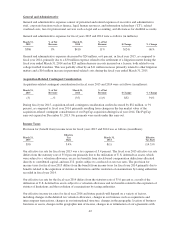
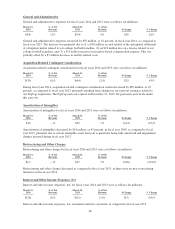
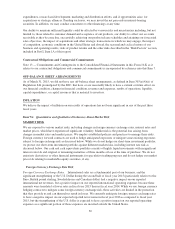
General and Administrative
General and administrative expenses for fiscal years 2014 and 2013 were as follows (in millions):
March 31,
2014
% of Net
Revenue
March 31,
2013
% of Net
Revenue $ Change % Change
$410 11% $354 9% $56 16%
General and administrative expenses increased by $56 million, or 16 percent, in fiscal year 2014, as compared to
fiscal year 2013. The increase was primarily due to (1) a $30 million accrual related to the anticipated settlement
of a litigation matter related to our college football franchise, (2) an $18 million loss on a license related to our
college football franchise, and (3) a $13 million increase in incentive-based compensation expense. This was
partially offset by a $7 million decrease in facility-related costs.
Acquisition-Related Contingent Consideration
Acquisition-related contingent consideration for fiscal years 2014 and 2013 were as follows (in millions):
March 31,
2014
% of Net
Revenue
March 31,
2013
% of Net
Revenue $ Change % Change
$(35) (1)% $(64) (2)% $29 45%
During fiscal year 2014, acquisition-related contingent consideration credits decreased by $29 million, or 45
percent, as compared to fiscal year 2013, primarily resulting from changes in our earn-out estimates related to
our PopCap acquisition. The PopCap earn-out expired on December 31, 2013. No payments were made under
this earn-out.
Amortization of Intangibles
Amortization of intangibles for fiscal years 2014 and 2013 were as follows (in millions):
March 31,
2014
% of Net
Revenue
March 31,
2013
% of Net
Revenue $ Change % Change
$16 —% $30 1% $(14) (47)%
Amortization of intangibles decreased by $14 million, or 47 percent, in fiscal year 2014, as compared to fiscal
year 2013, primarily due to certain intangible assets from our acquisitions being fully amortized and impairment
charges incurred during fiscal year 2013.
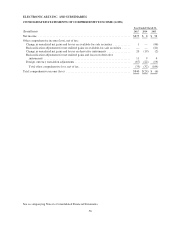
Restructuring and Other Charges
Restructuring and other charges for fiscal years 2014 and 2013 were as follows (in millions):
March 31,
2014
% of Net
Revenue
March 31,
2013
% of Net
Revenue $ Change % Change
$(1) —% $27 1% $(28) (104)%
Restructuring and other charges decreased as compared to fiscal year 2013, as there were no new restructuring
initiatives in fiscal year 2014.
Interest and Other Income (Expense), Net
Interest and other income (expense), net, for fiscal years 2014 and 2013 were as follows (in millions):
March 31,
2014
% of Net
Revenue
March 31,
2013
% of Net
Revenue $ Change % Change
$(26) (1)% $(21) (1)% $(5) (24)%
Interest and other income (expense), net, remained relatively consistent, as compared to fiscal year 2013.
46