Electronic Arts 2015 Annual Report Download - page 134
Download and view the complete annual report
Please find page 134 of the 2015 Electronic Arts annual report below. You can navigate through the pages in the report by either clicking on the pages listed below, or by using the keyword search tool below to find specific information within the annual report.-
 1
1 -
2
-
3
-
4
-
5
-
6
-
7
-
8
-
9
-
10
-
11
-
12
-
13
-
14
-
15
-
16
-
17
-
18
-
19
-
20
-
21
-
22
-
23
-
24
-
25
-
26
-
27
-
28
-
29
-
30
-
31
-
32
-
33
-
34
-
35
-
36
-
37
-
38
-
39
-
40
-
41
-
42
-
43
-
44
-
45
-
46
-
47
-
48
-
49
-
50
-
51
-
52
-
53
-
54
-
55
-
56
-
57
-
58
-
59
-
60
-
61
-
62
-
63
-
64
-
65
-
66
-
67
-
68
-
69
-
70
-
71
-
72
-
73
-
74
-
75
-
76
-
77
-
78
-
79
-
80
-
81
-
82
-
83
-
84
-
85
-
86
-
87
-
88
-
89
-
90
-
91
-
92
-
93
-
94
-
95
-
96
-
97
-
98
-
99
-
100
-
101
-
102
-
103
-
104
-
105
-
106
-
107
-
108
-
109
-
110
-
111
-
112
-
113
-
114
-
115
-
116
-
117
-
118
-
119
-
120
-
121
-
122
-
123
-
 124
124 -
 125
125 -
 126
126 -
 127
127 -
 128
128 -
 129
129 -
 130
130 -
 131
131 -
 132
132 -
 133
133 -
 134
134 -
 135
135 -
 136
136 -
 137
137 -
 138
138 -
 139
139 -
 140
140 -
 141
141 -
 142
142 -
 143
143 -
 144
144 -
145
-
146
-
147
-
148
-
149
-
150
-
151
-
152
-
153
-
154
-
155
-
156
-
157
-
158
-
159
-
160
-
161
-
162
-
163
-
164
-
165
-
166
-
167
-
168
-
169
-
170
-
171
-
172
-
173
-
174
-
175
-
176
-
177
-
178
-
179
-
180
 |
 |
of the price protection is generally the difference between the old wholesale price and the new reduced wholesale
price. In certain countries for our PC and console packaged goods software products, we also have a practice of
allowing channel partners to return older software products in the channel in exchange for a credit allowance. As
a general practice, we do not give cash refunds.
Taxes Collected from Customers and Remitted to Governmental Authorities
Taxes assessed by a government authority that are both imposed on and concurrent with specific revenue
transactions between us and our customers are presented on a net basis in our Consolidated Statements of
Operations.
Concentration of Credit Risk, Significant Customers, Franchises and Channel Partners
We extend credit to various retailers and channel partners. Collection of trade receivables may be affected by
changes in economic or other industry conditions and may, accordingly, impact our overall credit risk. Although
we generally do not require collateral, we perform ongoing credit evaluations of our customers and maintain
reserves for potential credit losses. Invoices are aged based on contractual terms with our customers. The
provision for doubtful accounts is recorded as a charge to general and administrative expense when a potential
loss is identified. Losses are written off against the allowance when the receivable is determined to be
uncollectible. At March 31, 2015, we had two customers who accounted for approximately 26 percent and 10
percent of our consolidated gross receivables. At March 31, 2014, we had three customers who accounted for 17
percent, 15 percent, and 11 percent of our consolidated gross receivables.
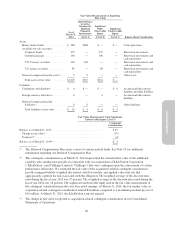
A majority of our sales are made to major retailers, distributors, and digital resellers. During the fiscal year ended
March 31, 2015, approximately 58 percent of our net revenue was derived from our top ten customers. Though
our products and services are available to consumers through a variety of retailers and directly through us, the
concentration of our sales in one, or a few, large customers could lead to a short-term disruption in our sales if
one or more of these customers significantly reduced their purchases or ceased to carry our products and services,
and could make us more vulnerable to collection risk if one or more of these large customers became unable to
pay for our products or declared bankruptcy.
A significant portion of our revenue has historically been derived from games and services based on a few
popular franchises. For example, in fiscal year 2015, net revenue generated from the sale of products and services
associated with our three largest franchises accounted for approximately 54 percent of our net revenue.
Currently, a majority of our revenue is derived through sales of products and services on hardware consoles from
Sony and Microsoft. For the fiscal years ended March 31, 2015 and 2014, our net revenue for products and
services on Sony’s PlayStation 3 and 4, and Microsoft’s Xbox 360 and One consoles (combined across all four
platforms) was 66 percent and 55 percent, respectively. In the fiscal year ended March 31, 2013, our net revenue
for products and services on the PlayStation 3 and Xbox 360 combined was 60 percent. These platform partners
have significant influence over the products and services that we offer on their platform. Our agreements with
Sony and Microsoft typically give significant control to them over the approval, manufacturing and distribution
of our products and services, which could, in certain circumstances, leave us unable to get our products and
services approved, manufactured and provided to customers.
Short-term investments are placed with high quality financial institutions or in short-duration, investment-grade
securities. We limit the amount of credit exposure in any one financial institution or type of investment
instrument.
Royalties and Licenses
Royalty-based obligations with content licensors and distribution affiliates are either paid in advance and
capitalized as prepaid royalties or are accrued as incurred and subsequently paid. These royalty-based obligations
are generally expensed to cost of revenue generally at the greater of the contractual rate or an effective royalty
rate based on the total projected net revenue for contracts with guaranteed minimums.
64