Electronic Arts 2015 Annual Report Download - page 45
Download and view the complete annual report
Please find page 45 of the 2015 Electronic Arts annual report below. You can navigate through the pages in the report by either clicking on the pages listed below, or by using the keyword search tool below to find specific information within the annual report.-
 1
1 -
2
-
3
-
4
-
5
-
6
-
7
-
8
-
9
-
10
-
11
-
12
-
13
-
14
-
15
-
16
-
17
-
18
-
19
-
20
-
21
-
22
-
23
-
24
-
25
-
26
-
27
-
28
-
29
-
30
-
31
-
32
-
33
-
34
-
 35
35 -
 36
36 -
 37
37 -
 38
38 -
 39
39 -
 40
40 -
 41
41 -
 42
42 -
 43
43 -
 44
44 -
 45
45 -
 46
46 -
 47
47 -
 48
48 -
 49
49 -
 50
50 -
 51
51 -
 52
52 -
 53
53 -
 54
54 -
 55
55 -
56
-
57
-
58
-
59
-
60
-
61
-
62
-
63
-
64
-
65
-
66
-
67
-
68
-
69
-
70
-
71
-
72
-
73
-
74
-
75
-
76
-
77
-
78
-
79
-
80
-
81
-
82
-
83
-
84
-
85
-
86
-
87
-
88
-
89
-
90
-
91
-
92
-
93
-
94
-
95
-
96
-
97
-
98
-
99
-
100
-
101
-
102
-
103
-
104
-
105
-
106
-
107
-
108
-
109
-
110
-
111
-
112
-
113
-
114
-
115
-
116
-
117
-
118
-
119
-
120
-
121
-
122
-
123
-
124
-
125
-
126
-
127
-
128
-
129
-
130
-
131
-
132
-
133
-
134
-
135
-
136
-
137
-
138
-
139
-
140
-
141
-
142
-
143
-
144
-
145
-
146
-
147
-
148
-
149
-
150
-
151
-
152
-
153
-
154
-
155
-
156
-
157
-
158
-
159
-
160
-
161
-
162
-
163
-
164
-
165
-
166
-
167
-
168
-
169
-
170
-
171
-
172
-
173
-
174
-
175
-
176
-
177
-
178
-
179
-
180
 |
 |

Proxy Statement
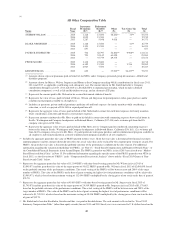
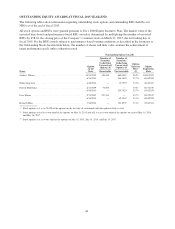
FISCAL 2015 SUMMARY COMPENSATION TABLE
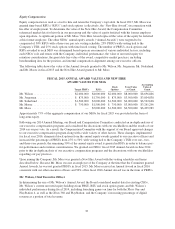
The following table shows information concerning the compensation earned by or awarded to our Chief
Executive Officer, our Chief Financial Officer, and our next three most highly compensated executive officers
for fiscal 2015 and, where applicable, fiscal 2014 and 2013. For purposes of the compensation tables that follow,
we refer to these individuals collectively as the “Named Executive Officers” or “NEOs”.
Name and Principal Position
Fiscal
Year
Salary
($)
Bonus
($)
Stock
Awards
($)(1)
Option
Awards
($)(2)
Non-Equity
Incentive Plan
Compensation
($)(3)
All Other
Compensation
($)(4)
Total
($)
ANDREW WILSON .......... 2015 880,769 — 6,696,870(5)(6) 1,999,996 2,000,000 55,255 11,634,890
Chief Executive Officer 2014 674,038 — 3,896,250 8,607,400 780,474 17,219 13,975,381
2013 510,865 — 4,283,250 — 827,488 10,373 5,631,976
BLAKE JORGENSEN ........ 2015 694,231 — 2,929,842(5)(7) 874,996 1,216,250 16,759 5,732,078
Executive Vice President, 2014 666,154 — 9,766,750 — 840,000 16,424 11,289,328
Chief Financial Officer 2013 362,500 350,000 2,842,000 — 269,208 657 3,824,365
PATRICK SÖDERLUND(8) .... 2015 642,646 — 5,022,628(5)(9) 1,500,000 1,178,780 141,611 8,485,665
Executive Vice President, 2014 634,518 — 3,896,250 — 725,000 95,983 5,351,751
EA Studios 2013 584,583 — 4,283,250 — 259,050 67,154 5,194,037
PETER MOORE ............. 2015 666,154 — 2,511,296(5)(10) 750,000 1,050,000 16,718 4,994,168
Executive Vice President, 2014 646,154 — 3,376,750 — 685,000 24,965 4,732,869
Chief Operating Officer 2013 628,155 — 1,716,000 — 423,811 10,443 2,778,409
KENNETH MOSS ........... 2015 365,962 170,000(11) 4,999,990(12) 1,499,999 425,391 75,237 7,536,579
Executive Vice President,
Chief Technology Officer
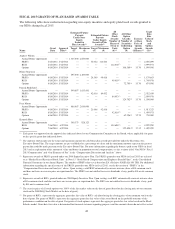
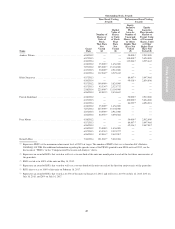
(1) Represents the aggregate grant date fair value of RSUs with time-based and, where applicable, performance-based vesting granted in those
years. Grant date fair value is determined for financial statement reporting purposes and the amounts shown do not reflect the actual value
realized by the recipient. For RSUs with time-based vesting, grant date fair value is calculated using the closing price of our common
stock on the grant date. Refer to footnote 5 below for a discussion of the fair value calculation for RSUs with performance-based vesting.
For additional information regarding the valuation methodology for RSUs, see Note 15, “Stock-Based Compensation and Employee
Benefit Plans”, to the Consolidated Financial Statements in our Annual Report. For additional information regarding the specific terms of
the RSUs with time-based vesting granted to our NEOs in fiscal 2015, see the “Fiscal 2014 Grants of Plan-Based Awards Table” below.
(2) Represents the grant date fair value of stock options granted. For additional information on the valuation methodology and assumptions
used to calculate the fair value of stock options, see Note 15, “Stock-Based Compensation and Employee Benefit Plans”, of the
Consolidated Financial Statements in our Annual Report.
(3) Represents amounts awarded under the Executive Bonus Plan for fiscal 2015, 2014 and 2013, in addition to amounts awarded to Messrs.
Söderlund and Wilson under the EA Bonus Plan in fiscal 2013. For additional information about the bonuses paid to our NEOs in fiscal
2015, see “Our NEOs’ Fiscal 2015 Compensation and “Cash Bonus Awards” in the “Compensation Discussion and Analysis” above.
39