Electronic Arts 2015 Annual Report Download - page 140
Download and view the complete annual report
Please find page 140 of the 2015 Electronic Arts annual report below. You can navigate through the pages in the report by either clicking on the pages listed below, or by using the keyword search tool below to find specific information within the annual report.-
 1
1 -
2
-
3
-
4
-
5
-
6
-
7
-
8
-
9
-
10
-
11
-
12
-
13
-
14
-
15
-
16
-
17
-
18
-
19
-
20
-
21
-
22
-
23
-
24
-
25
-
26
-
27
-
28
-
29
-
30
-
31
-
32
-
33
-
34
-
35
-
36
-
37
-
38
-
39
-
40
-
41
-
42
-
43
-
44
-
45
-
46
-
47
-
48
-
49
-
50
-
51
-
52
-
53
-
54
-
55
-
56
-
57
-
58
-
59
-
60
-
61
-
62
-
63
-
64
-
65
-
66
-
67
-
68
-
69
-
70
-
71
-
72
-
73
-
74
-
75
-
76
-
77
-
78
-
79
-
80
-
81
-
82
-
83
-
84
-
85
-
86
-
87
-
88
-
89
-
90
-
91
-
92
-
93
-
94
-
95
-
96
-
97
-
98
-
99
-
100
-
101
-
102
-
103
-
104
-
105
-
106
-
107
-
108
-
109
-
110
-
111
-
112
-
113
-
114
-
115
-
116
-
117
-
118
-
119
-
120
-
121
-
122
-
123
-
124
-
125
-
126
-
127
-
128
-
129
-
 130
130 -
 131
131 -
 132
132 -
 133
133 -
 134
134 -
 135
135 -
 136
136 -
 137
137 -
 138
138 -
 139
139 -
 140
140 -
 141
141 -
 142
142 -
 143
143 -
 144
144 -
 145
145 -
 146
146 -
 147
147 -
 148
148 -
 149
149 -
 150
150 -
151
-
152
-
153
-
154
-
155
-
156
-
157
-
158
-
159
-
160
-
161
-
162
-
163
-
164
-
165
-
166
-
167
-
168
-
169
-
170
-
171
-
172
-
173
-
174
-
175
-
176
-
177
-
178
-
179
-
180
 |
 |

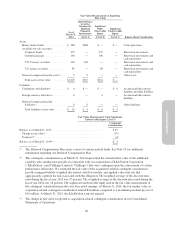
(d) During fiscal year 2015, we made payments totaling $1 million to settle certain performance milestones
achieved in connection with one of our acquisitions. During fiscal year 2014, we made payments totaling $4
million to settle certain performance milestones achieved in connection with two of our acquisitions.
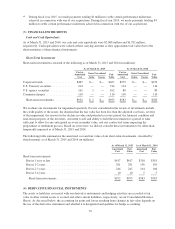
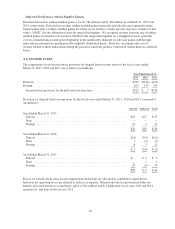
(3) FINANCIAL INSTRUMENTS
Cash and Cash Equivalents
As of March 31, 2015 and 2014, our cash and cash equivalents were $2,068 million and $1,782 million,
respectively. Cash equivalents were valued at their carrying amounts as they approximate fair value due to the
short maturities of these financial instruments.
Short-Term Investments
Short-term investments consisted of the following as of March 31, 2015 and 2014 (in millions):
As of March 31, 2015 As of March 31, 2014
Cost or
Amortized
Cost
Gross Unrealized Fair
Value
Cost or
Amortized
Cost
Gross Unrealized Fair
ValueGains Losses Gains Losses
Corporate bonds ................... $467 $— $— $467 $279 $— $— $279
U.S. Treasury securities ............. 214 — — 214 114 — — 114
U.S. agency securities ............... 161 1 — 162 80 — — 80
Commercial paper .................. 110 — — 110 110 — — 110
Short-term investments ............ $952 $ 1 $— $953 $583 $— $— $583
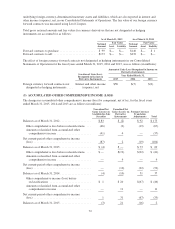
We evaluate our investments for impairment quarterly. Factors considered in the review of investments include
the credit quality of the issuer, the duration that the fair value has been less than the adjusted cost basis, severity
of the impairment, the reason for the decline in value and potential recovery period, the financial condition and
near-term prospects of the investees, our intent to sell and ability to hold the investment for a period of time
sufficient to allow for any anticipated recovery in market value, and any contractual terms impacting the
prepayment or settlement process. Based on our review, we did not consider these investments to be other-than-
temporarily impaired as of March 31, 2015 and 2014.
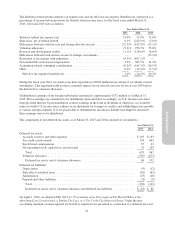
The following table summarizes the amortized cost and fair value of our short-term investments, classified by
stated maturity as of March 31, 2015 and 2014 (in millions):
As of March 31, 2015 As of March 31, 2014
Amortized
Cost
Fair
Value
Amortized
Cost
Fair
Value
Short-term investments
Due in 1 year or less ....................................... $417 $417 $318 $318
Due in 1-2 years .......................................... 281 281 156 156
Due in 2-3 years .......................................... 244 245 104 104
Due in 3-4 years .......................................... 10 10 5 5
Short-term investments ................................... $952 $953 $583 $583
(4) DERIVATIVE FINANCIAL INSTRUMENTS
The assets or liabilities associated with our derivative instruments and hedging activities are recorded at fair
value in other current assets or accrued and other current liabilities, respectively, on our Consolidated Balance
Sheets. As discussed below, the accounting for gains and losses resulting from changes in fair value depends on
the use of the derivative instrument and whether it is designated and qualifies for hedge accounting.
70