Electronic Arts 2015 Annual Report Download - page 40
Download and view the complete annual report
Please find page 40 of the 2015 Electronic Arts annual report below. You can navigate through the pages in the report by either clicking on the pages listed below, or by using the keyword search tool below to find specific information within the annual report.-
 1
1 -
2
-
3
-
4
-
5
-
6
-
7
-
8
-
9
-
10
-
11
-
12
-
13
-
14
-
15
-
16
-
17
-
18
-
19
-
20
-
21
-
22
-
23
-
24
-
25
-
26
-
27
-
28
-
29
-
 30
30 -
 31
31 -
 32
32 -
 33
33 -
 34
34 -
 35
35 -
 36
36 -
 37
37 -
 38
38 -
 39
39 -
 40
40 -
 41
41 -
 42
42 -
 43
43 -
 44
44 -
 45
45 -
 46
46 -
 47
47 -
 48
48 -
 49
49 -
 50
50 -
51
-
52
-
53
-
54
-
55
-
56
-
57
-
58
-
59
-
60
-
61
-
62
-
63
-
64
-
65
-
66
-
67
-
68
-
69
-
70
-
71
-
72
-
73
-
74
-
75
-
76
-
77
-
78
-
79
-
80
-
81
-
82
-
83
-
84
-
85
-
86
-
87
-
88
-
89
-
90
-
91
-
92
-
93
-
94
-
95
-
96
-
97
-
98
-
99
-
100
-
101
-
102
-
103
-
104
-
105
-
106
-
107
-
108
-
109
-
110
-
111
-
112
-
113
-
114
-
115
-
116
-
117
-
118
-
119
-
120
-
121
-
122
-
123
-
124
-
125
-
126
-
127
-
128
-
129
-
130
-
131
-
132
-
133
-
134
-
135
-
136
-
137
-
138
-
139
-
140
-
141
-
142
-
143
-
144
-
145
-
146
-
147
-
148
-
149
-
150
-
151
-
152
-
153
-
154
-
155
-
156
-
157
-
158
-
159
-
160
-
161
-
162
-
163
-
164
-
165
-
166
-
167
-
168
-
169
-
170
-
171
-
172
-
173
-
174
-
175
-
176
-
177
-
178
-
179
-
180
 |
 |

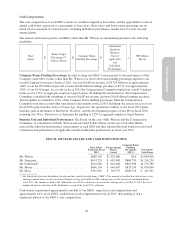
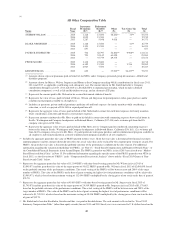
Cash Bonus Awards
Cash bonus awards for each of our NEOs were funded under the Electronic Arts Inc. Executive Bonus Plan (the
“Executive Bonus Plan”). Cash bonuses payable under this plan are intended to qualify as tax deductible
“performance-based compensation” under Section 162(m) of the Internal Revenue Code. At the beginning of
each fiscal year, the Compensation Committee selects the Executive Bonus Plan participants, performance
period, performance measures, and the formula used to determine maximum bonus funding. In fiscal 2015, all of
our NEOs were selected to participate in this plan, and the Compensation Committee selected non-GAAP net
income as the performance measure because the level of profitability is a key business focus in any year. The
performance period was established as fiscal 2015, and the formula to determine the maximum bonus funding for
each NEO was the lower of: (1) 300% of their annual base salary or (2) 0.5% of our fiscal 2015 non-GAAP net
income for each NEO other than our CEO, for whom the maximum was 1% of our fiscal 2015 non-GAAP net
income. For fiscal 2015, the Company reported non-GAAP net income of $806 million which resulted in a
maximum bonus award funding of 300% of annual base salary for each of our NEOs. The Compensation
Committee then exercised its discretion to reduce actual bonus awards for each individual based on the
Company’s overall financial performance, the terms of the Executive Bonus Plan, target bonus award and
individual performance against strategic and operational objectives, as discussed in “Our NEOs’ Fiscal 2015
Compensation” above.
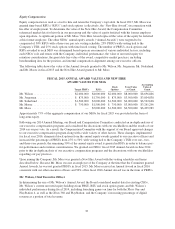
RSUs
Annual Award grants of RSUs to our NEOs vest annually over 35 months from the grant date in equal
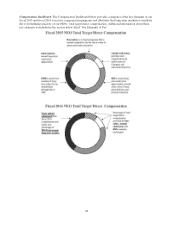
increments each May. For fiscal 2015, approximately 50% of the total value of our NEOs’ Annual Awards were
made in the form of RSUs.
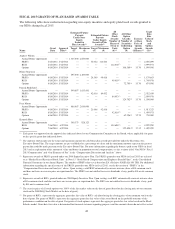
PRSUs
The Compensation Committee has granted PRSUs as part of the annual equity awards to Executive Vice
President level employees and above since fiscal 2012. Beginning in fiscal 2016, Senior Vice President level
employees and above will participate in this program. The number of shares earned adjusts based upon changes
in our TSR relative to the performance of the companies in the NASDAQ-100 Index (the “Relative NASDAQ-
100 TSR”) measured over 12-month, 24-month cumulative and 36-month cumulative periods (each such period,
a “Vesting Measurement Period”). PRSUs may vest upon approximately the first, second and third anniversaries
of the date of grant (which we call “Vesting Opportunities”). For fiscal 2015, approximately 25% of the total
value of our NEOs’ Annual Awards were made in the form of PRSUs.
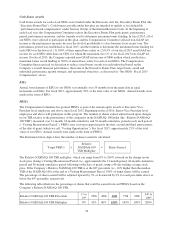
The illustration below depicts how the number of shares earned is calculated:
Target PRSUs x
Relative
NASDAQ-100
TSR Multiplier
= Shares Earned
The Relative NASDAQ-100 TSR multiplier, which can range from 0% to 200% is based on the change in our
stock price during a Vesting Measurement Period (i.e., approximately the 12-month period, 24-month cumulative
period and 36-month cumulative period following of the date of grant), using a 90-day trailing average stock
price. If the Company’s Relative NASDAQ-100 TSR is at the 60th percentile (i.e., 10% higher than the median
TSR of the NASDAQ-100) at the end of a Vesting Measurement Period, 100% of target shares will be earned.
The percentage of shares earned will be adjusted upward by 3% or downward by 2% for each percentile above or
below the 60th percentile, respectively.
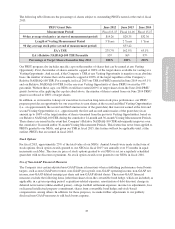
The following table illustrates the percentage of shares that could be earned from our PRSUs based on the
Company’s Relative NASDAQ-100 TSR.
Relative NASDAQ-100 TSR Percentile 1st to
10th 25th 40th 60th 75th 90th 94th to
100th
Relative NASDAQ-100 TSR Multiplier 0% 30% 60% 100% 145% 190% 200%
34