Electronic Arts 2015 Annual Report Download - page 41
Download and view the complete annual report
Please find page 41 of the 2015 Electronic Arts annual report below. You can navigate through the pages in the report by either clicking on the pages listed below, or by using the keyword search tool below to find specific information within the annual report.-
 1
1 -
2
-
3
-
4
-
5
-
6
-
7
-
8
-
9
-
10
-
11
-
12
-
13
-
14
-
15
-
16
-
17
-
18
-
19
-
20
-
21
-
22
-
23
-
24
-
25
-
26
-
27
-
28
-
29
-
30
-
 31
31 -
 32
32 -
 33
33 -
 34
34 -
 35
35 -
 36
36 -
 37
37 -
 38
38 -
 39
39 -
 40
40 -
 41
41 -
 42
42 -
 43
43 -
 44
44 -
 45
45 -
 46
46 -
 47
47 -
 48
48 -
 49
49 -
 50
50 -
 51
51 -
52
-
53
-
54
-
55
-
56
-
57
-
58
-
59
-
60
-
61
-
62
-
63
-
64
-
65
-
66
-
67
-
68
-
69
-
70
-
71
-
72
-
73
-
74
-
75
-
76
-
77
-
78
-
79
-
80
-
81
-
82
-
83
-
84
-
85
-
86
-
87
-
88
-
89
-
90
-
91
-
92
-
93
-
94
-
95
-
96
-
97
-
98
-
99
-
100
-
101
-
102
-
103
-
104
-
105
-
106
-
107
-
108
-
109
-
110
-
111
-
112
-
113
-
114
-
115
-
116
-
117
-
118
-
119
-
120
-
121
-
122
-
123
-
124
-
125
-
126
-
127
-
128
-
129
-
130
-
131
-
132
-
133
-
134
-
135
-
136
-
137
-
138
-
139
-
140
-
141
-
142
-
143
-
144
-
145
-
146
-
147
-
148
-
149
-
150
-
151
-
152
-
153
-
154
-
155
-
156
-
157
-
158
-
159
-
160
-
161
-
162
-
163
-
164
-
165
-
166
-
167
-
168
-
169
-
170
-
171
-
172
-
173
-
174
-
175
-
176
-
177
-
178
-
179
-
180
 |
 |

Proxy Statement
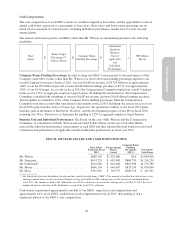
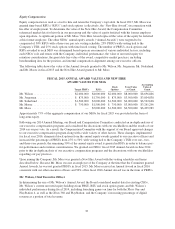
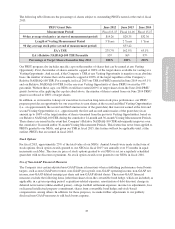
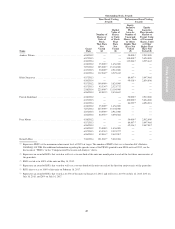
The following table illustrates the percentage of shares subject to outstanding PRSUs earned at the end of fiscal
2015:
PRSU Grant Date June 2012 June 2013 June 2014
Measurement Period Fiscal 13-15 Fiscal 14-16 Fiscal 15-17
90 day average stock price (at start of measurement period) $14.26 $20.35 $32.36
Length of Vesting Measurement Period 3 Years 2 Years 1 Year
90 day average stock price (at end of measurement period) $53.42
EA’s TSR 275.7% 162.5% 65.1%
EA’s Relative NASDAQ-100 TSR Percentile 95th 96th 97th
Percentage of Target Shares Earned in May 2015 200% 200% 200%
Our PRSU program also includes specific caps on the number of shares that can be earned at any Vesting
Opportunity. First, the number of shares earned is capped at 200% of the target shares available for vesting at a
Vesting Opportunity. And second, if the Company’s TSR at any Vesting Opportunity is negative on an absolute
basis, the number of shares that can be earned is capped at 100% of the target regardless of the Company’s
Relative NASDAQ-100 TSR. For example, in fiscal 2015 our TSR for PRSUs granted in June 2014 was 65.1%
and our Relative NASDAQ-100 TSR for the one-year Vesting Opportunity of those PRSUs was in the 97th
percentile. Without these caps, our NEOs would have earned 209% of target shares from the June 2014 PRSU
grants; however after applying the cap described above, the number of shares earned from our June 2014 PRSU
grant was reduced to 200% of target shares.
In addition, as an incentive to keep our executives focused on long-term stock price performance, our PRSU
program provides an opportunity for our executives to earn shares at the second and third Vesting Opportunities
(i.e., on approximately the second and third anniversaries of the grant date) that were not earned at the first and
second Vesting Opportunities (i.e., approximately the first and second anniversaries of the grant date) in an
amount up to 100% of the target number of shares unearned from the previous Vesting Opportunities, based on
our Relative NASDAQ-100 TSR during the cumulative 24-month and 36-month Vesting Measurement Periods.
These shares are earned in the event that Company’s Relative NASDAQ-100 TSR subsequently improves over
the cumulative 24-month and/or 36-month Vesting Measurement Periods. This feature has never been applied to
PRSUs granted to our NEOs, and given our TSR in fiscal 2015, this feature will not be applicable until, at the
earliest, PRSUs that are earned in fiscal 2018.
Stock Options
For fiscal 2015, approximately 25% of the total value of our NEOs’ Annual Awards were made in the form of
stock options. Stock option awards granted to our NEOs in fiscal 2015 vest annually over 35 months in equal
increments each May. The exercise price of stock options granted to our NEOs is set on a regularly scheduled
grant date with no discount or premium. No stock option awards were granted to our NEOs in fiscal 2016.
Use of Non-GAAP Financial Measures
The Company uses certain adjusted non-GAAP financial measures when establishing performance-based bonus
targets, such as non-GAAP net revenue, non-GAAP gross profit, non-GAAP operating income, non-GAAP net
income, non-GAAP diluted earnings per share and non-GAAP diluted shares. These non-GAAP financial
measures exclude the following items (other than shares from the convertible bond hedge, which are included) as
applicable, in a given reporting period: acquisition-related expenses, amortization of debt discount, change in
deferred net revenue (online-enabled games), college football settlement expenses, income tax adjustments, loss
on licensed intellectual property commitment, shares from convertible bond hedge and stock-based
compensation, among others. In addition, for these purposes, we make further adjustments to our publicly
disclosed non-GAAP measures to add back bonus expense.
35