Philips 2007 Annual Report Download - page 102
Download and view the complete annual report
Please find page 102 of the 2007 Philips annual report below. You can navigate through the pages in the report by either clicking on the pages listed below, or by using the keyword search tool below to find specific information within the annual report.-
 1
1 -
2
-
3
-
4
-
5
-
6
-
7
-
8
-
9
-
10
-
11
-
12
-
13
-
14
-
15
-
16
-
17
-
18
-
19
-
20
-
21
-
22
-
23
-
24
-
25
-
26
-
27
-
28
-
29
-
30
-
31
-
32
-
33
-
34
-
35
-
36
-
37
-
38
-
39
-
40
-
41
-
42
-
43
-
44
-
45
-
46
-
47
-
48
-
49
-
50
-
51
-
52
-
53
-
54
-
55
-
56
-
57
-
58
-
59
-
60
-
61
-
62
-
63
-
64
-
65
-
66
-
67
-
68
-
69
-
70
-
71
-
72
-
73
-
74
-
75
-
76
-
77
-
78
-
79
-
80
-
81
-
82
-
83
-
84
-
85
-
86
-
87
-
88
-
89
-
90
-
91
-
 92
92 -
 93
93 -
 94
94 -
 95
95 -
 96
96 -
 97
97 -
 98
98 -
 99
99 -
 100
100 -
 101
101 -
 102
102 -
 103
103 -
 104
104 -
 105
105 -
 106
106 -
 107
107 -
 108
108 -
 109
109 -
 110
110 -
 111
111 -
 112
112 -
113
-
114
-
115
-
116
-
117
-
118
-
119
-
120
-
121
-
122
-
123
-
124
-
125
-
126
-
127
-
128
-
129
-
130
-
131
-
132
-
133
-
134
-
135
-
136
-
137
-
138
-
139
-
140
-
141
-
142
-
143
-
144
-
145
-
146
-
147
-
148
-
149
-
150
-
151
-
152
-
153
-
154
-
155
-
156
-
157
-
158
-
159
-
160
-
161
-
162
-
163
-
164
-
165
-
166
-
167
-
168
-
169
-
170
-
171
-
172
-
173
-
174
-
175
-
176
-
177
-
178
-
179
-
180
-
181
-
182
-
183
-
184
-
185
-
186
-
187
-
188
-
189
-
190
-
191
-
192
-
193
-
194
-
195
-
196
-
197
-
198
-
199
-
200
-
201
-
202
-
203
-
204
-
205
-
206
-
207
-
208
-
209
-
210
-
211
-
212
-
213
-
214
-
215
-
216
-
217
-
218
-
219
-
220
-
221
-
222
-
223
-
224
-
225
-
226
-
227
-
228
-
229
-
230
-
231
-
232
-
233
-
234
-
235
-
236
-
237
-
238
-
239
-
240
-
241
-
242
-
243
-
244
-
245
-
246
-
247
-
248
-
249
-
250
-
251
-
252
-
253
-
254
-
255
-
256
-
257
-
258
-
259
-
260
-
261
-
262
 |
 |

Philips Annual Report 2007108
Philips invests available cash and cash equivalents with
various nancial institutions and is exposed to credit risk
with these counterparties. Philips is also exposed to credit
risks in the event of non-performance by counterparties
with respect to nancial derivative instruments.
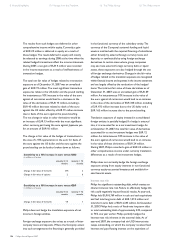
Philips actively manages concentration risk and on a daily
basis measures the potential loss under certain stress
scenarios, should a nancial counterparty default. These
worst-case scenario losses are monitored and limited by
the company. As of December 31, 2007 Philips had credit
risk exceeding EUR 25 million with the following number
of counterparties:
Credit risk with number of counterparties
25-100
million
100-500
million
500-2,000
million
AAA-rated governments 1 2 2
AAA-rated government banks 1 − 2
AAA-rated bank counterparties
− − 1
AA-rated bank counterparties 5 2 −
A rated bank counterparties 2 − −
The company does not enter into any nancial derivative
instruments to protect against default by nancial
counterparties. However, where possible the company
requires all nancial counterparties with whom it deals
in derivative transactions to complete legally enforceable
netting agreements under an International Swap Dealers
Association master agreement or otherwise prior to
trading, and whenever possible, to have a strong credit
rating from Standard & Poor’s and Moody’s Investor
Services. Philips also regularly monitors the development
of credit default swap prices of its nancial counterparties.
Wherever possible, cash is invested and nancial transactions
are concluded with nancial institutions with strong credit
ratings or with governments or government-backed
institutions. As at December 31, 2007, Philips expects
no impact as a result of the sub-prime mortgage crisis.
Country risk
Philips is exposed to country risk by the very nature
of running a global business. Country risk is the risk
that political, legal, or economic developments in a
single country could adversely impact our performance.
The country risk per country is dened as the sum of
the equity of all subsidiaries and associated companies in
country cross-border transactions, such as intercompany
loans, guarantees (unless country risk is explicitly excluded
in the guarantee), accounts receivable from third parties
and intercompany accounts receivable. The country risk
is monitored on a regular basis.
As of December 31, 2007, the Company had country risk
exposure in the Netherlands of EUR 13 billion and in the
United States of EUR 6 billion. Other countries
exceeding EUR 1 billion but less than EUR 5 billion
included Belgium, China (including Hong Kong),
South Korea and Taiwan. Countries where the risk
exceeded EUR 200 million included Austria, France,
Italy, Japan, Malaysia, Poland, Spain, Switzerland and
the United Kingdom. The degree of risk of a country
is taken into account when new investments are
considered. The Company does not, however, use
nancial derivative instruments to hedge country risk.
Other insurable risks
Philips is covered for a range of different kinds of losses
by global insurance policies in the areas of property
damage, business interruption, general and products
liability, transport, directors’ and ofcers’ liability, employment
practice liability, fraud, and aviation product liability.
To lower exposures and to avoid potential losses,
Philips has a worldwide Risk Engineering program in
place. The main focus in this program is on property
damage and business interruption risks, which also
include interdependencies. Philips sites, and also
a limited number of sites of key suppliers, are inspected
on a regular basis by the Risk Engineering personnel of
the insurer. Inspections are carried out against predened
Risk Engineering standards which are agreed between
Philips and the insurers. Recommendations are made in
a Risk Management report and are reviewed centrally.
This is the basis for decision-making by the local
management of the business as to which recommendations
will be implemented. For all policies, deductibles are in
place, which vary from EUR 250,000 to EUR 500,000 per
occurrence and this variance is designed to differentiate
between the existing risk categories within Philips. Above
this rst layer of working deductibles, Philips operates its
own re-insurance captive, which during 2007 retained
EUR 2.5 million per occurrence for the property damage
and business interruption losses and EUR 5 million in
the aggregate per year. For general and product liability
claims, the captive retained EUR 1.5 million per claim
and EUR 6 million in the aggregate. New contracts were
signed on December 31, 2007 for the coming year, whereby
the reinsurance captive retentions remained unchanged.
8 Financial highlights 10 Message from the President 16 The Philips Group 62 The Philips sectors