Philips 2007 Annual Report Download - page 36
Download and view the complete annual report
Please find page 36 of the 2007 Philips annual report below. You can navigate through the pages in the report by either clicking on the pages listed below, or by using the keyword search tool below to find specific information within the annual report.-
 1
1 -
2
-
3
-
4
-
5
-
6
-
7
-
8
-
9
-
10
-
11
-
12
-
13
-
14
-
15
-
16
-
17
-
18
-
19
-
20
-
21
-
22
-
23
-
24
-
25
-
 26
26 -
 27
27 -
 28
28 -
 29
29 -
 30
30 -
 31
31 -
 32
32 -
 33
33 -
 34
34 -
 35
35 -
 36
36 -
 37
37 -
 38
38 -
 39
39 -
 40
40 -
 41
41 -
 42
42 -
 43
43 -
 44
44 -
 45
45 -
 46
46 -
47
-
48
-
49
-
50
-
51
-
52
-
53
-
54
-
55
-
56
-
57
-
58
-
59
-
60
-
61
-
62
-
63
-
64
-
65
-
66
-
67
-
68
-
69
-
70
-
71
-
72
-
73
-
74
-
75
-
76
-
77
-
78
-
79
-
80
-
81
-
82
-
83
-
84
-
85
-
86
-
87
-
88
-
89
-
90
-
91
-
92
-
93
-
94
-
95
-
96
-
97
-
98
-
99
-
100
-
101
-
102
-
103
-
104
-
105
-
106
-
107
-
108
-
109
-
110
-
111
-
112
-
113
-
114
-
115
-
116
-
117
-
118
-
119
-
120
-
121
-
122
-
123
-
124
-
125
-
126
-
127
-
128
-
129
-
130
-
131
-
132
-
133
-
134
-
135
-
136
-
137
-
138
-
139
-
140
-
141
-
142
-
143
-
144
-
145
-
146
-
147
-
148
-
149
-
150
-
151
-
152
-
153
-
154
-
155
-
156
-
157
-
158
-
159
-
160
-
161
-
162
-
163
-
164
-
165
-
166
-
167
-
168
-
169
-
170
-
171
-
172
-
173
-
174
-
175
-
176
-
177
-
178
-
179
-
180
-
181
-
182
-
183
-
184
-
185
-
186
-
187
-
188
-
189
-
190
-
191
-
192
-
193
-
194
-
195
-
196
-
197
-
198
-
199
-
200
-
201
-
202
-
203
-
204
-
205
-
206
-
207
-
208
-
209
-
210
-
211
-
212
-
213
-
214
-
215
-
216
-
217
-
218
-
219
-
220
-
221
-
222
-
223
-
224
-
225
-
226
-
227
-
228
-
229
-
230
-
231
-
232
-
233
-
234
-
235
-
236
-
237
-
238
-
239
-
240
-
241
-
242
-
243
-
244
-
245
-
246
-
247
-
248
-
249
-
250
-
251
-
252
-
253
-
254
-
255
-
256
-
257
-
258
-
259
-
260
-
261
-
262
 |
 |

Philips Annual Report 200742
Net income
In 2007, income from continuing operations amounted
to EUR 4,601 million, an increase of EUR 3,700 million
compared with 2006. The improvement was driven by
EUR 651 million higher EBIT and a EUR 2,585 million
increase in nancial income, primarily due to the sale
of shares in TSMC. The EUR 455 million higher income
tax charges were more than offset by a EUR 920 million
increase in results relating to equity-accounted investees,
which included a EUR 508 million gain on the sale of
shares of LG.Philips LCD as well as a EUR 456 million
increase in that company’s operational results.
The loss from discontinued operations amounted
to EUR 433 million, mainly due to the aforementioned
MedQuist-related losses, whereas 2006 included a total
gain of EUR 4,283 million from the sale of a majority
stake in the Semiconductors division.
Net income for the Group showed a prot of
EUR 4,168 million, or EUR 3.84 per common share,
compared to EUR 5,383 million, or EUR 4.58 per
common share, in 2006.
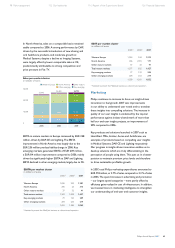
Performance by market cluster
Philips monitors its performance on a geographical axis
based on the following market clusters:
key emerging markets, including China, India and Latin•
America
other emerging markets, including emerging markets •
in Central and Eastern Europe, Russia, Ukraine and
Central Asia, the Middle East and Africa, Turkey and
the ASEAN zone
mature markets, including Western Europe, North •
America, Japan, Korea, Australia and New Zealand.
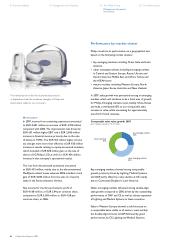
In 2007, sales growth was particularly strong in emerging
markets, which will continue to be a focal area of growth
for Philips. Emerging markets, most notably China, Russia
and India, contributed 60% to our comparable sales
increase in value, while accounting for approximately
one third of total revenues.
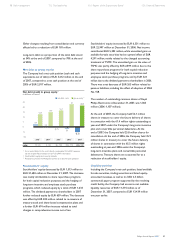
Comparable sales value growth 2007
per market cluster, in % of total
key emerging markets
26%
other emerging markets
34%
mature markets
40%
Key emerging markets showed strong comparable
growth, primarily driven by Lighting, Medical Systems
and DAP, partly offset by a sales decline at CE, mainly
due to Connected Displays in Latin America.
Other emerging markets delivered strong double-digit
sales growth compared to 2006, driven by the outstanding
performance of DAP and CE as well as robust expansion
of Lighting and Medical Systems in these countries.
Sales in Western Europe showed a solid increase on
a comparable basis, visible in all sectors, most notably
the double-digit increase at DAP, followed by good
performances by CE, Lighting and Medical Systems.
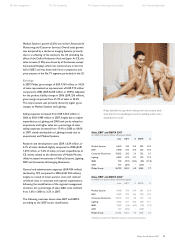
The market launch of the rst dual-branded products
in September made the combined strengths of Philips and
Avent clearly visible to our consumers.
8 Financial highlights 10 Message from the President 16 The Philips Group
Management discussion
and analysis
62 The Philips sectors