Philips 2007 Annual Report Download - page 42
Download and view the complete annual report
Please find page 42 of the 2007 Philips annual report below. You can navigate through the pages in the report by either clicking on the pages listed below, or by using the keyword search tool below to find specific information within the annual report.-
 1
1 -
2
-
3
-
4
-
5
-
6
-
7
-
8
-
9
-
10
-
11
-
12
-
13
-
14
-
15
-
16
-
17
-
18
-
19
-
20
-
21
-
22
-
23
-
24
-
25
-
26
-
27
-
28
-
29
-
30
-
31
-
 32
32 -
 33
33 -
 34
34 -
 35
35 -
 36
36 -
 37
37 -
 38
38 -
 39
39 -
 40
40 -
 41
41 -
 42
42 -
 43
43 -
 44
44 -
 45
45 -
 46
46 -
 47
47 -
 48
48 -
 49
49 -
 50
50 -
 51
51 -
 52
52 -
53
-
54
-
55
-
56
-
57
-
58
-
59
-
60
-
61
-
62
-
63
-
64
-
65
-
66
-
67
-
68
-
69
-
70
-
71
-
72
-
73
-
74
-
75
-
76
-
77
-
78
-
79
-
80
-
81
-
82
-
83
-
84
-
85
-
86
-
87
-
88
-
89
-
90
-
91
-
92
-
93
-
94
-
95
-
96
-
97
-
98
-
99
-
100
-
101
-
102
-
103
-
104
-
105
-
106
-
107
-
108
-
109
-
110
-
111
-
112
-
113
-
114
-
115
-
116
-
117
-
118
-
119
-
120
-
121
-
122
-
123
-
124
-
125
-
126
-
127
-
128
-
129
-
130
-
131
-
132
-
133
-
134
-
135
-
136
-
137
-
138
-
139
-
140
-
141
-
142
-
143
-
144
-
145
-
146
-
147
-
148
-
149
-
150
-
151
-
152
-
153
-
154
-
155
-
156
-
157
-
158
-
159
-
160
-
161
-
162
-
163
-
164
-
165
-
166
-
167
-
168
-
169
-
170
-
171
-
172
-
173
-
174
-
175
-
176
-
177
-
178
-
179
-
180
-
181
-
182
-
183
-
184
-
185
-
186
-
187
-
188
-
189
-
190
-
191
-
192
-
193
-
194
-
195
-
196
-
197
-
198
-
199
-
200
-
201
-
202
-
203
-
204
-
205
-
206
-
207
-
208
-
209
-
210
-
211
-
212
-
213
-
214
-
215
-
216
-
217
-
218
-
219
-
220
-
221
-
222
-
223
-
224
-
225
-
226
-
227
-
228
-
229
-
230
-
231
-
232
-
233
-
234
-
235
-
236
-
237
-
238
-
239
-
240
-
241
-
242
-
243
-
244
-
245
-
246
-
247
-
248
-
249
-
250
-
251
-
252
-
253
-
254
-
255
-
256
-
257
-
258
-
259
-
260
-
261
-
262
 |
 |

Philips Annual Report 200748
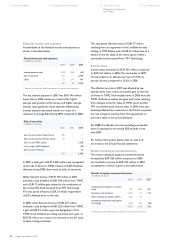
Cash ows provided by continuing
operations
Condensed consolidated statements of cash ows
for the years ended December 31, 2005, 2006 and
2007 are presented below:
Condensed consolidated cash ow statements
in millions of euros
20051) 20061) 2007
Cash ows from operating activities:
Net income 2,868 5,383 4,168
(Income) loss from discontinued
operations 11 (4,482) 433
Adjustments to reconcile net
income to net cash provided by
operating activities (1,732) (571) (3,082)
Net cash provided by operating
activities
1,147 330 1,519
Net cash provided by (used for)
investing activities 1,694 (2,802) 3,930
Cash ows before nancing activities 2,841 (2,472) 5,449
Net cash used for nancing activities (2,589) (3,715) (2,368)
Cash provided by (used for) con-
tinuing operations 252 (6,187) 3,081
Net cash provided by (used for)
discontinued operations 533 7,114 (115)
Effect of changes in exchange rates
on cash positions 159 (197) (112)
Total change in cash and cash equivalents
944 730 2,854
Cash and cash equivalents at
beginning of year 4,349 5,293 6,023
Less cash and cash equivalents at
end of year - discontinued operations
150 137 108
Cash and cash equivalents at end of
year - continuing operations 5,143 5,886 8,769
1) Restated to present the MedQuist business as a discontinued operation.
Please refer to the consolidated statements of cash ows which are part
of the chapter Group nancial statements.
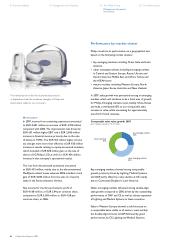
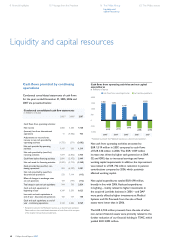
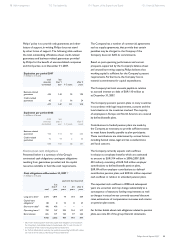
Cash flows from operating activities and net capital
expenditures
in millions of euros
cash flows from operating activities net capital expenditures
2,000
1,500
1,000
500
0
(500)
(1,000)
1,482
(634)
20031)
1,392
(613)
20041)
1,147
(499)
20051)
330
(688)
20061)
1,519
(698)
2007
1) Restated to present the MedQuist business as a discontinued operation
Net cash from operating activities amounted to
EUR 1,519 million in 2007, compared to cash ows
of EUR 330 million in 2006. This EUR 1,189 million
increase was driven by higher cash generation at DAP,
CE and GMS, due to increased earnings and lower
working capital requirements. In addition, the improvement
was related to a EUR 742 million reduction in pension
contributions compared to 2006, which positively
affected working capital.
Net capital expenditures totaled EUR 698 million,
broadly in line with 2006. Reduced expenditures
in Lighting – mainly related to higher investments in
the acquired Lumileds business in 2006 – and DAP
were partly offset by higher investments at Medical
Systems and CE. Proceeds from the sale of xed
assets were lower than in 2006.
The EUR 4,105 million proceeds from the sale of other
non-current nancial assets were primarily related to the
further reduction of our nancial holding in TSMC, which
yielded EUR 3,895 million.
Liquidity and capital resources
8 Financial highlights 10 Message from the President 16 The Philips Group
Liquidity and
capital resources
62 The Philips sectors