Philips 2007 Annual Report Download - page 252
Download and view the complete annual report
Please find page 252 of the 2007 Philips annual report below. You can navigate through the pages in the report by either clicking on the pages listed below, or by using the keyword search tool below to find specific information within the annual report.-
 1
1 -
2
-
3
-
4
-
5
-
6
-
7
-
8
-
9
-
10
-
11
-
12
-
13
-
14
-
15
-
16
-
17
-
18
-
19
-
20
-
21
-
22
-
23
-
24
-
25
-
26
-
27
-
28
-
29
-
30
-
31
-
32
-
33
-
34
-
35
-
36
-
37
-
38
-
39
-
40
-
41
-
42
-
43
-
44
-
45
-
46
-
47
-
48
-
49
-
50
-
51
-
52
-
53
-
54
-
55
-
56
-
57
-
58
-
59
-
60
-
61
-
62
-
63
-
64
-
65
-
66
-
67
-
68
-
69
-
70
-
71
-
72
-
73
-
74
-
75
-
76
-
77
-
78
-
79
-
80
-
81
-
82
-
83
-
84
-
85
-
86
-
87
-
88
-
89
-
90
-
91
-
92
-
93
-
94
-
95
-
96
-
97
-
98
-
99
-
100
-
101
-
102
-
103
-
104
-
105
-
106
-
107
-
108
-
109
-
110
-
111
-
112
-
113
-
114
-
115
-
116
-
117
-
118
-
119
-
120
-
121
-
122
-
123
-
124
-
125
-
126
-
127
-
128
-
129
-
130
-
131
-
132
-
133
-
134
-
135
-
136
-
137
-
138
-
139
-
140
-
141
-
142
-
143
-
144
-
145
-
146
-
147
-
148
-
149
-
150
-
151
-
152
-
153
-
154
-
155
-
156
-
157
-
158
-
159
-
160
-
161
-
162
-
163
-
164
-
165
-
166
-
167
-
168
-
169
-
170
-
171
-
172
-
173
-
174
-
175
-
176
-
177
-
178
-
179
-
180
-
181
-
182
-
183
-
184
-
185
-
186
-
187
-
188
-
189
-
190
-
191
-
192
-
193
-
194
-
195
-
196
-
197
-
198
-
199
-
200
-
201
-
202
-
203
-
204
-
205
-
206
-
207
-
208
-
209
-
210
-
211
-
212
-
213
-
214
-
215
-
216
-
217
-
218
-
219
-
220
-
221
-
222
-
223
-
224
-
225
-
226
-
227
-
228
-
229
-
230
-
231
-
232
-
233
-
234
-
235
-
236
-
237
-
238
-
239
-
240
-
241
-
 242
242 -
 243
243 -
 244
244 -
 245
245 -
 246
246 -
 247
247 -
 248
248 -
 249
249 -
 250
250 -
 251
251 -
 252
252 -
 253
253 -
 254
254 -
 255
255 -
 256
256 -
 257
257 -
 258
258 -
 259
259 -
 260
260 -
 261
261 -
 262
262
 |
 |

Philips Annual Report 2007258
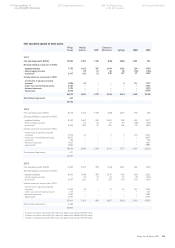
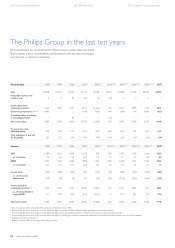
General data 19981) 1999 2000 20012) 2002
2) 3)
2003
2) 3) 4)
2004
2) 3) 4)
2005
2) 3) 4)
2006
2) 3) 4)
2007
4)
Sales 30,459 31,459 37,862 31,725 26,788 23,614 24,488 25,445 26,682 26,793
Percentage increase over
previous year 3 3 20 (16) (2) (10) 4 4 5 −
Income (loss) from
continuing operations 1,025 1,595 9,577 (2,331) (2,863) 219 3,164 2,879 901 4,601
Discontinued operations
1) 2) 3) 4)
4,891 − − (144) (343) 490 (328) (11) 4,482 (433)
Cumulative effect of a change
in accounting principle − − 85 − − (14) − − − −
Net income (loss) 5,900 1,590 9,662 (2,475) (3,206) 695 2,836 2,868 5,383 4,168
Turnover rate of net
operating capital 2.95 3.20 3.12 2.15 3.07 4.48 5.27 4.92 3.09 2.59
Total employees at year-end
(in thousands) 234 227 219 189
5)
170
5)
164
5)
162
5)
159
5)
122
5)
124
5)
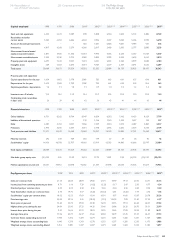
Income 1998
1)
1999 2000 2001
2)
2002
2) 3)
2003
2) 3) 4)
2004
2) 3) 4)
2005
2) 3) 4)
2006
2) 3) 4)
2007
4)
EBIT 1,289 1,553 4,258 (1,251) 943 924 1,733 1,558 1,201 1,852
as a % of sales 4.2 4.9 11.2 (3.9) 3.5 3.9 7.1 6.1 4.5 6.9
EBITA 1,547 1,768 4,600 (810) 1,464 1,018 1,838 1,652 1,386 2,065
as a % of sales 5.1 5.6 12.1 (2.6) 5.5 4.3 7.5 6.5 5.2 7.7
Income taxes (162) (208) (563) 428 (133) (38) (227) (526) (167) (622)
as a % of income
before taxes (17) (14) (9) 20 (10) (5.6) (11.6) (31.6) (13.6) (13.9)
Income (loss) from
continuing operations
6)
1,025 1,595 9,577 (2,331) (2,863) 219 3,164 2,879 901 4,601
as a % of stockholders’
equity (ROE) 9.7 10.9 48.5 (11.2) (15.3) 1.7 22.7 18.4 4.3 21.0
Net income (loss) 5,900 1,590 9,662 (2,475) (3,206) 695 2,836 2,868 5,383 4,168
1) Discontinued operations reect the effect of the sale of PolyGram N.V. in 1998.
2) Discontinued operations from 2001 onwards reect the effect of the sale of MDS in 2006, for which previous years have been restated.
3) Discontinued operations from 2002 onwards reect the effect of the sale of Semiconductors in 2006, for which previous years have been restated.
4) Discontinued operations from 2003 onwards reect the effect of classifying the MedQuist business as a discontinued operation, for which previous years have been restated.
5) Including discontinued operations.
6) Before cumulative effect of a change in accounting principles.
The Philips Group in the last ten years
All amounts based on US GAAP and in millions of euros unless otherwise stated.
Due to factors such as consolidations and divestments, the amounts, percentages
and ratios are not directly comparable.
128 Group nancial statements 188 IFRS information 240 Company nancial statements