Philips 2007 Annual Report Download - page 75
Download and view the complete annual report
Please find page 75 of the 2007 Philips annual report below. You can navigate through the pages in the report by either clicking on the pages listed below, or by using the keyword search tool below to find specific information within the annual report.-
 1
1 -
2
-
3
-
4
-
5
-
6
-
7
-
8
-
9
-
10
-
11
-
12
-
13
-
14
-
15
-
16
-
17
-
18
-
19
-
20
-
21
-
22
-
23
-
24
-
25
-
26
-
27
-
28
-
29
-
30
-
31
-
32
-
33
-
34
-
35
-
36
-
37
-
38
-
39
-
40
-
41
-
42
-
43
-
44
-
45
-
46
-
47
-
48
-
49
-
50
-
51
-
52
-
53
-
54
-
55
-
56
-
57
-
58
-
59
-
60
-
61
-
62
-
63
-
64
-
 65
65 -
 66
66 -
 67
67 -
 68
68 -
 69
69 -
 70
70 -
 71
71 -
 72
72 -
 73
73 -
 74
74 -
 75
75 -
 76
76 -
 77
77 -
 78
78 -
 79
79 -
 80
80 -
 81
81 -
 82
82 -
 83
83 -
 84
84 -
 85
85 -
86
-
87
-
88
-
89
-
90
-
91
-
92
-
93
-
94
-
95
-
96
-
97
-
98
-
99
-
100
-
101
-
102
-
103
-
104
-
105
-
106
-
107
-
108
-
109
-
110
-
111
-
112
-
113
-
114
-
115
-
116
-
117
-
118
-
119
-
120
-
121
-
122
-
123
-
124
-
125
-
126
-
127
-
128
-
129
-
130
-
131
-
132
-
133
-
134
-
135
-
136
-
137
-
138
-
139
-
140
-
141
-
142
-
143
-
144
-
145
-
146
-
147
-
148
-
149
-
150
-
151
-
152
-
153
-
154
-
155
-
156
-
157
-
158
-
159
-
160
-
161
-
162
-
163
-
164
-
165
-
166
-
167
-
168
-
169
-
170
-
171
-
172
-
173
-
174
-
175
-
176
-
177
-
178
-
179
-
180
-
181
-
182
-
183
-
184
-
185
-
186
-
187
-
188
-
189
-
190
-
191
-
192
-
193
-
194
-
195
-
196
-
197
-
198
-
199
-
200
-
201
-
202
-
203
-
204
-
205
-
206
-
207
-
208
-
209
-
210
-
211
-
212
-
213
-
214
-
215
-
216
-
217
-
218
-
219
-
220
-
221
-
222
-
223
-
224
-
225
-
226
-
227
-
228
-
229
-
230
-
231
-
232
-
233
-
234
-
235
-
236
-
237
-
238
-
239
-
240
-
241
-
242
-
243
-
244
-
245
-
246
-
247
-
248
-
249
-
250
-
251
-
252
-
253
-
254
-
255
-
256
-
257
-
258
-
259
-
260
-
261
-
262
 |
 |

Philips Annual Report 2007 81Philips Annual Report 2007 81
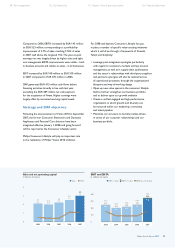
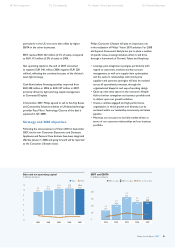
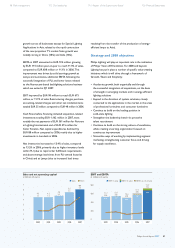
Sales and net operating capital
in billions of euros
Sales NOC
12
10
8
6
4
2
0
(2)
9.2
(0.1)
2003
9.9
(0.2)
2004
10.4
(0.3)
2005
10.6
(0.2)
2006
10.4
(0.2)
2007
EBIT and EBITA
in millions of euros
EBITA in valueEBIT in value EBITA as a % of sales
0
125
250
375
500
2003
167
1.8
167
2004
268
268
2.7
2005
405
404
3.9
2006
314
313
3.0
2007
325
3.1
322
particularly in the US, was more than offset by higher
EBITA in the other businesses.
EBIT reached EUR 322 million (3.1% of sales), compared
to EUR 313 million (3.0% of sales) in 2006.
Net operating capital at the end of 2007 amounted
to negative EUR 246 million (2006: negative EUR 228
million), re ecting the continued success of the division’s
asset-light strategy.
Cash ows before nancing activities improved from
EUR 248 million in 2006 to EUR 357 million in 2007,
primarily driven by tight working capital management
at Connected Displays.
In December 2007, Philips agreed to sell its Set-Top Boxes
and Connectivity Solutions activities to UK-based technology
provider Pace Micro Technology. Closure of the deal is
expected in Q1 2008.
Strategy and 2008 objectives
Following the announcement of Vision 2010 in September
2007, the former Consumer Electronics and Domestic
Appliances and Personal Care divisions have been integrated
effective January 1, 2008, and going forward will be reported
as the Consumer Lifestyle sector.
Philips Consumer Lifestyle will play an important role
in the realization of Philips’ Vision 2010 ambition. For 2008
and beyond, Consumer Lifestyle has put in place a number
of speci c value-creating initiatives which it will drive
through a framework of Growth, Talent and Simplicity:
Leverage post-integration synergies, particularly with •
regard to customers, markets and key account
management, as well as in supply chain optimization
and the sector’s relationships with third-party
suppliers and partners; synergies will also be realized
across all operational processes, through the
organizational blueprint and way-of-working design
Open up new value spaces in the consumer lifestyle •
eld to further strengthen our business portfolio and
to deliver upon our growth ambition
Create a uni ed, engaged and high-performance •
organization in which growth and diversity can be
nurtured within our leadership community and talent
pipeline
Maximize our structure to be fully market-driven, in •
terms of our customer relationships and our business
portfolio.
98 Risk management 112 Our leadership 116 Report of the Supervisory Board 126 Financial Statements