Philips 2007 Annual Report Download - page 225
Download and view the complete annual report
Please find page 225 of the 2007 Philips annual report below. You can navigate through the pages in the report by either clicking on the pages listed below, or by using the keyword search tool below to find specific information within the annual report.-
 1
1 -
2
-
3
-
4
-
5
-
6
-
7
-
8
-
9
-
10
-
11
-
12
-
13
-
14
-
15
-
16
-
17
-
18
-
19
-
20
-
21
-
22
-
23
-
24
-
25
-
26
-
27
-
28
-
29
-
30
-
31
-
32
-
33
-
34
-
35
-
36
-
37
-
38
-
39
-
40
-
41
-
42
-
43
-
44
-
45
-
46
-
47
-
48
-
49
-
50
-
51
-
52
-
53
-
54
-
55
-
56
-
57
-
58
-
59
-
60
-
61
-
62
-
63
-
64
-
65
-
66
-
67
-
68
-
69
-
70
-
71
-
72
-
73
-
74
-
75
-
76
-
77
-
78
-
79
-
80
-
81
-
82
-
83
-
84
-
85
-
86
-
87
-
88
-
89
-
90
-
91
-
92
-
93
-
94
-
95
-
96
-
97
-
98
-
99
-
100
-
101
-
102
-
103
-
104
-
105
-
106
-
107
-
108
-
109
-
110
-
111
-
112
-
113
-
114
-
115
-
116
-
117
-
118
-
119
-
120
-
121
-
122
-
123
-
124
-
125
-
126
-
127
-
128
-
129
-
130
-
131
-
132
-
133
-
134
-
135
-
136
-
137
-
138
-
139
-
140
-
141
-
142
-
143
-
144
-
145
-
146
-
147
-
148
-
149
-
150
-
151
-
152
-
153
-
154
-
155
-
156
-
157
-
158
-
159
-
160
-
161
-
162
-
163
-
164
-
165
-
166
-
167
-
168
-
169
-
170
-
171
-
172
-
173
-
174
-
175
-
176
-
177
-
178
-
179
-
180
-
181
-
182
-
183
-
184
-
185
-
186
-
187
-
188
-
189
-
190
-
191
-
192
-
193
-
194
-
195
-
196
-
197
-
198
-
199
-
200
-
201
-
202
-
203
-
204
-
205
-
206
-
207
-
208
-
209
-
210
-
211
-
212
-
213
-
214
-
 215
215 -
 216
216 -
 217
217 -
 218
218 -
 219
219 -
 220
220 -
 221
221 -
 222
222 -
 223
223 -
 224
224 -
 225
225 -
 226
226 -
 227
227 -
 228
228 -
 229
229 -
 230
230 -
 231
231 -
 232
232 -
 233
233 -
 234
234 -
 235
235 -
236
-
237
-
238
-
239
-
240
-
241
-
242
-
243
-
244
-
245
-
246
-
247
-
248
-
249
-
250
-
251
-
252
-
253
-
254
-
255
-
256
-
257
-
258
-
259
-
260
-
261
-
262
 |
 |

Philips Annual Report 2007 231
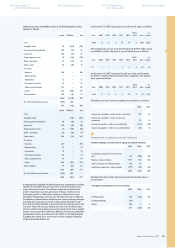
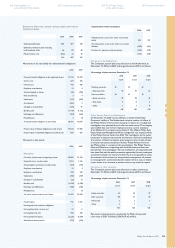
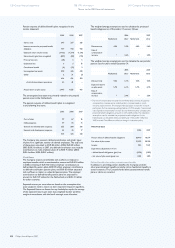
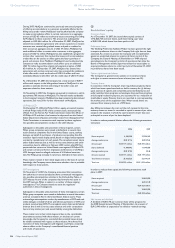
Movements in the net liability for other dened-benet obligations:
2006 2007
Projected benet obligation at the beginning of year 447 373
Service cost 4 3
Interest cost 26 26
Actuarial gains (12) 47
Curtailments − −
Plan amendments − (5)
Settlements − (6)
Changes in consolidation (2) 27
Benets paid (65) (32)
Exchange rate differences (26) (19)
Miscellaneous 1 (1)
Projected benet obligation at end of year 373 413
Present value of funded obligations at end of year − −
Present value of unfunded obligations at end of year 373 413
2006 2007
Funded status (373) (413)
Unrecognized actuarial losses (35) 31
Unrecognized psc − (5)
Net balances (408) (387)
Classication of the net balance is as follows:
Provision for other postretirement benets - (408) (387)
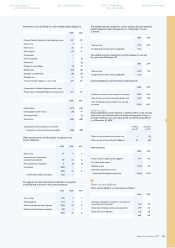
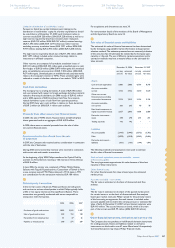
Other postretirement benet expense recognized in the
income statement:
2005 2006 2007
Service cost 19 4 3
Interest cost on accumulated
postretirement benets 40 26 26
Net actuarial loss recognized 4 (4) (4)
Curtailment (308) − −
(245) 26 25
of which discontinued operations (23) − −
The expense for other postretirement benets is recognized
in the following line items in the income statement:
2005 2006 2007
Cost of sales (50) 3 2
Selling expenses (11) 3 2
General and administrative expenses (156) 20 20
Research and development expenses (28) − 1
(245) 26 25
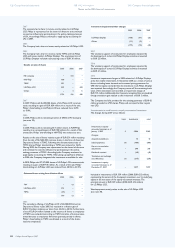
The weighted average assumptions used to calculate the postretirement
benet obligations other than pensions as of December 31 were
as follows:
2006 2007
Discount rate 7.2% 8.5%
Compensation increase (where applicable) 5.6% −
The weighted average assumptions used to calculate the net cost
for years ended December 31:
2006 2007
Discount rate 6.9% 7.2%
Compensation increase (where applicable) 5.6% −
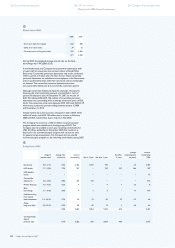
Assumed healthcare cost trend rates at December 31:
2006 2007
Healthcare cost trend rate assumed for next year 8.0% 9.0%
Rate that the cost trend rate will gradually reach 5.0% 7.0%
Year of reaching the rate at which it is assumed
to remain 2,014 2,015
Sensitivity analysis
Assumed healthcare trend rates have a signicant effect on the amounts
reported for the healthcare plans. A one percentage-point change in
assumed healthcare cost trend rates would have the following effects
as at December 31, 2007:
increase
with 1%
decrease
by 1%
Effect on total of service and interest cost 5 (3)
Effect on postretirement benet obligation 47 (40)
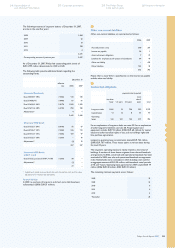
Historical data
2006 2007
Present value of dene-benet obligation 373 413
Fair value of plan assets − −
(Decit) surplus (373) 413
Experience adjustments in % on
- dened-benet obligations (gain) loss (1.6%) (0.2%)
57
Other current liabilities
Other current liabilities are summarized as follows:
2006 2007
Advances received from customers on orders not
covered by work in process 133 133
Other taxes including social security premiums 339 253
Other short-term liabilities 133 123
605 509
57
Group nancial statements
Notes to the IFRS nancial statements
Company nancial statements 250 Corporate governance246 Reconciliation of
non-US GAAP information 258 The Philips Group
in the last ten years 260
Investor information