Philips 2007 Annual Report Download - page 219
Download and view the complete annual report
Please find page 219 of the 2007 Philips annual report below. You can navigate through the pages in the report by either clicking on the pages listed below, or by using the keyword search tool below to find specific information within the annual report.-
 1
1 -
2
-
3
-
4
-
5
-
6
-
7
-
8
-
9
-
10
-
11
-
12
-
13
-
14
-
15
-
16
-
17
-
18
-
19
-
20
-
21
-
22
-
23
-
24
-
25
-
26
-
27
-
28
-
29
-
30
-
31
-
32
-
33
-
34
-
35
-
36
-
37
-
38
-
39
-
40
-
41
-
42
-
43
-
44
-
45
-
46
-
47
-
48
-
49
-
50
-
51
-
52
-
53
-
54
-
55
-
56
-
57
-
58
-
59
-
60
-
61
-
62
-
63
-
64
-
65
-
66
-
67
-
68
-
69
-
70
-
71
-
72
-
73
-
74
-
75
-
76
-
77
-
78
-
79
-
80
-
81
-
82
-
83
-
84
-
85
-
86
-
87
-
88
-
89
-
90
-
91
-
92
-
93
-
94
-
95
-
96
-
97
-
98
-
99
-
100
-
101
-
102
-
103
-
104
-
105
-
106
-
107
-
108
-
109
-
110
-
111
-
112
-
113
-
114
-
115
-
116
-
117
-
118
-
119
-
120
-
121
-
122
-
123
-
124
-
125
-
126
-
127
-
128
-
129
-
130
-
131
-
132
-
133
-
134
-
135
-
136
-
137
-
138
-
139
-
140
-
141
-
142
-
143
-
144
-
145
-
146
-
147
-
148
-
149
-
150
-
151
-
152
-
153
-
154
-
155
-
156
-
157
-
158
-
159
-
160
-
161
-
162
-
163
-
164
-
165
-
166
-
167
-
168
-
169
-
170
-
171
-
172
-
173
-
174
-
175
-
176
-
177
-
178
-
179
-
180
-
181
-
182
-
183
-
184
-
185
-
186
-
187
-
188
-
189
-
190
-
191
-
192
-
193
-
194
-
195
-
196
-
197
-
198
-
199
-
200
-
201
-
202
-
203
-
204
-
205
-
206
-
207
-
208
-
 209
209 -
 210
210 -
 211
211 -
 212
212 -
 213
213 -
 214
214 -
 215
215 -
 216
216 -
 217
217 -
 218
218 -
 219
219 -
 220
220 -
 221
221 -
 222
222 -
 223
223 -
 224
224 -
 225
225 -
 226
226 -
 227
227 -
 228
228 -
 229
229 -
230
-
231
-
232
-
233
-
234
-
235
-
236
-
237
-
238
-
239
-
240
-
241
-
242
-
243
-
244
-
245
-
246
-
247
-
248
-
249
-
250
-
251
-
252
-
253
-
254
-
255
-
256
-
257
-
258
-
259
-
260
-
261
-
262
 |
 |

Philips Annual Report 2007 225
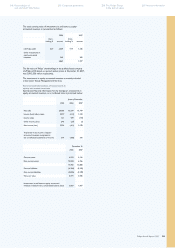
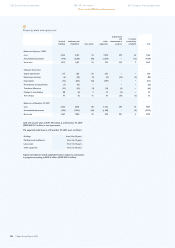
The earnings per share (EPS) data have been calculated as follows:
Plus incremental shares from assumed conversions of:
−
−
44
46
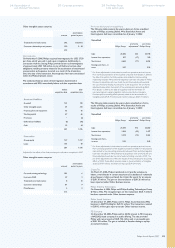
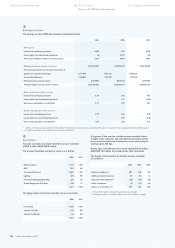
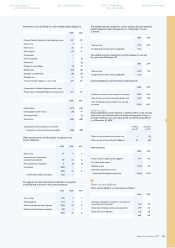
Inventories
Inventories are summarized as follows:
2006 2007
Raw materials and supplies 849 918
Work in process 380 391
Finished goods 1,859 2,015
Advance payments on work in process (208) (121)
2,880 3,203
The amounts recorded above are net of allowances for obsolescence.
As of December 31, 2007, the carrying amount of inventories carried
at fair value less cost-to-sell is EUR 190 million (2006: EUR 116 million).
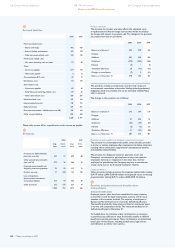
47
Other current assets
Other current assets include assets for derivative instruments
of EUR 275 million (2006: EUR 298 million), prepaid expenses of
EUR 347 million (2006: EUR 280 million) and held-for-trading
securities of EUR nil (2006: EUR 192 million).
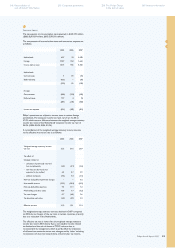
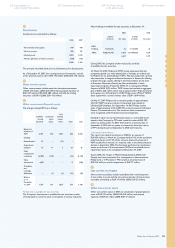
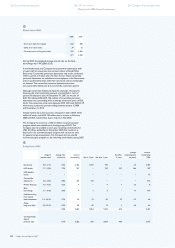
48
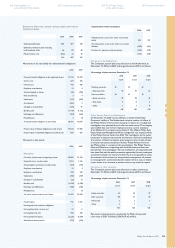
Other non-current nancial assets
The changes during 2007 are as follows:
available-
for-sale
securities
restricted
liquid
assets
cost-
method
invest-
ments other total
Balance as
of January 1,
2007 6,529 200 1,043 283 8,055
Changes:
Reclassications
19 − (19) − −
Acquisitions/
additions 15 11 5 34 65
Sales/
redemptions/
reductions (4,180) (109) − (25) (4,314)
Value
adjustments (607) − − 8 (599)
Translation
and
exchange
differences − (1) (2) (21) (24)
Balance
as of
December
31, 2007 1,776 101 1,027 279 3,183
Investments in available-for-sale securities
The Company’s investments in available-for-sale securities consist
of investments in common stock of companies in various industries.
46
47
48
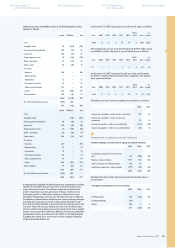
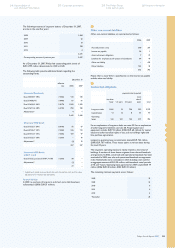
Major holdings in available-for-sale securities at December 31:
2006 2007
number
of shares fair value
number
of shares fair value
D&M
Holdings 11,126,640 32 11,126,640 32
TSMC
4,066,046,793
6,395
1,311,490,224
1,699
6,427 1,731
During 2007, the Company further reduced its portfolio
of available-for-sale securities.
On March 12, 2007, Philips and TSMC jointly announced that the
companies agreed to a multi-phased plan to facilitate an orderly exit
by Philips from its shareholding in TSMC. The plan comprised a private
sale transaction to long-term nancial investors in Taiwan, the offering
of shares through a public offering in the United States (in the form
of American Depositary Shares) and the participation in stock
repurchase programs initiated by TSMC. As a consequence Philips
disposed of EUR 2,755 million TSMC shares and realized an aggregate
gain of EUR 2,528 million, which was presented under Financial income
and expense. As of December 31, 2007 Philips owns 4.96% of TSMC’s
share capital with a current market value of EUR 1,699 million.
On May 17, 2007, Philips sold its remaining stake of approximately
2.5% (4,914,875 common shares) of the issued share capital in
US-based JDS Uniphase. On September 14, 2007, Philips sold its
stake of approximately 2.5% (4,587,333 common shares) in US-based
Nuance Communications Inc. The results on these transactions
were recognized under Financial income and expenses.
Included in other non-current nancial assets is a convertible bond
issued to the Company by TPV with a total fair value of EUR 189
million as at December 31, 2007. The bond has a maturity date of
September 5, 2010 with an option to convert the bond into shares
of TPV during the period September 5, 2008 until maturity.
Cost-method investments
The major cost-method investment is NXP, for an amount of
EUR 854 million, of which the Company holds 19.9% of the cumulative
preferred shares and 17.5% of the common shares. The interest in
NXP resulted from the sale of a majority stake in the Semiconductors
division in September 2006. The Company performed an impairment
review on the cost of the investment in NXP and concluded that no
impairment needs to be recognized at December 31, 2007.
In June 2006, the merger of Mobile Display Systems (MDS) with
Toppoly has been completed. As a consequence of the transaction,
Philips holds a 17.4% stake in TPO, valued at amortized cost of
EUR 103 million, net of an impairment of EUR 77 million.
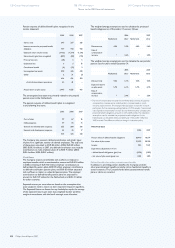
49
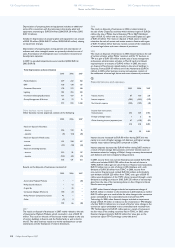
Non-current receivables
Non-current receivables include receivables with a remaining term
of more than one year, and the non-current portion of income taxes
receivable amounting to EUR 14 million (2006: EUR 25 million).
50
Other non-current assets
Other non-current assets in 2007 are comprised of prepaid pension
costs of EUR 331 million (2006: EUR 343 million) and prepaid
expenses of EUR 53 million (2006: EUR 47 million).
49
50
of EUR 3 million (2006: EUR 8 million).
The accounts receivable, net, split per sector are as follows:
The ageing analysis of accounts receivable, net, is set out below:
45
Group nancial statements
Notes to the IFRS nancial statements
Company nancial statements 250 Corporate governance246 Reconciliation of
non-US GAAP information 258 The Philips Group
in the last ten years 260
Investor information