Philips 2007 Annual Report Download - page 104
Download and view the complete annual report
Please find page 104 of the 2007 Philips annual report below. You can navigate through the pages in the report by either clicking on the pages listed below, or by using the keyword search tool below to find specific information within the annual report.-
 1
1 -
2
-
3
-
4
-
5
-
6
-
7
-
8
-
9
-
10
-
11
-
12
-
13
-
14
-
15
-
16
-
17
-
18
-
19
-
20
-
21
-
22
-
23
-
24
-
25
-
26
-
27
-
28
-
29
-
30
-
31
-
32
-
33
-
34
-
35
-
36
-
37
-
38
-
39
-
40
-
41
-
42
-
43
-
44
-
45
-
46
-
47
-
48
-
49
-
50
-
51
-
52
-
53
-
54
-
55
-
56
-
57
-
58
-
59
-
60
-
61
-
62
-
63
-
64
-
65
-
66
-
67
-
68
-
69
-
70
-
71
-
72
-
73
-
74
-
75
-
76
-
77
-
78
-
79
-
80
-
81
-
82
-
83
-
84
-
85
-
86
-
87
-
88
-
89
-
90
-
91
-
92
-
93
-
 94
94 -
 95
95 -
 96
96 -
 97
97 -
 98
98 -
 99
99 -
 100
100 -
 101
101 -
 102
102 -
 103
103 -
 104
104 -
 105
105 -
 106
106 -
 107
107 -
 108
108 -
 109
109 -
 110
110 -
 111
111 -
 112
112 -
 113
113 -
 114
114 -
115
-
116
-
117
-
118
-
119
-
120
-
121
-
122
-
123
-
124
-
125
-
126
-
127
-
128
-
129
-
130
-
131
-
132
-
133
-
134
-
135
-
136
-
137
-
138
-
139
-
140
-
141
-
142
-
143
-
144
-
145
-
146
-
147
-
148
-
149
-
150
-
151
-
152
-
153
-
154
-
155
-
156
-
157
-
158
-
159
-
160
-
161
-
162
-
163
-
164
-
165
-
166
-
167
-
168
-
169
-
170
-
171
-
172
-
173
-
174
-
175
-
176
-
177
-
178
-
179
-
180
-
181
-
182
-
183
-
184
-
185
-
186
-
187
-
188
-
189
-
190
-
191
-
192
-
193
-
194
-
195
-
196
-
197
-
198
-
199
-
200
-
201
-
202
-
203
-
204
-
205
-
206
-
207
-
208
-
209
-
210
-
211
-
212
-
213
-
214
-
215
-
216
-
217
-
218
-
219
-
220
-
221
-
222
-
223
-
224
-
225
-
226
-
227
-
228
-
229
-
230
-
231
-
232
-
233
-
234
-
235
-
236
-
237
-
238
-
239
-
240
-
241
-
242
-
243
-
244
-
245
-
246
-
247
-
248
-
249
-
250
-
251
-
252
-
253
-
254
-
255
-
256
-
257
-
258
-
259
-
260
-
261
-
262
 |
 |

Philips Annual Report 2007110
investment policy, planned in the Netherlands and the
US, to fully implement their new investment strategies
will lead to a further reduction in Funded-Status-at-Risk.
Equity risk is the major source of risk to the Funded
Status. It results from the relatively large allocation
to equities in the US and the large absolute exposure
to equities in the Dutch pension fund, even after the
reduction in its equity allocation in the last few months
of 2007. The contribution of interest rate risk results from
the interest rate mismatches between assets and liabilities
in the Netherlands, the US and Germany. Although interest
rate risk in the Netherlands was reduced in the last few
months of 2007, the Dutch pension fund still contributes
most to interest rate risk. This will change as a result
of the planned investment changes in 2008. Following
these changes, the remaining exposure in the US will
be the dominant contribution to interest rate risk.
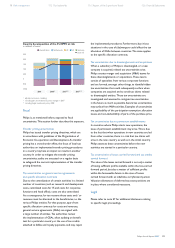
The Dutch pension fund contributes most to in ation risk,
due to its size and indexation policy. Foreign exchange risk
contributes relatively little to the Funded-Status-at-risk.
The diversi cation effect is largely attributable to the
positive correlation between in ation and interest rates
and the negative correlation between bonds and equities.
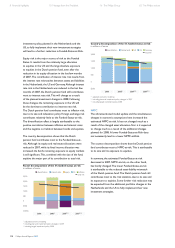
The country decomposition shows that the Dutch
pension fund contributes most to the Funded-Status-at-
risk. Although its equity and real estate allocations were
reduced in 2007, while its xed income allocation was
increased, the fund’s remaining exposure to equity markets
is still signi cant. This, combined with the size of the fund,
explains the major part of its contribution to total risk.
Factor decomposition of the 5% funded status at risk
in millions of euros
equity
interest rates
FX
inflation
diversification
total risk
(1,000)
(500)
0
500
1,000
1,500
2,000
2,500
2006 20061) 20071) 2) 20071) 3)
1) adjusted economic modeling
2) including plan and investment policy changes in 2007
3) including target investment policy 2008
total risk
diversification
Netherlands
US
Germany
UK
Country decomposition of the 5% funded status at risk
in millions of euros
(500)
0
500
1,000
1,500
2,000
2006 20061) 20071) 2) 20071) 3)
1) adjusted economic modeling
2) including plan and investment policy changes in 2007
3) including target investment policy 2008
NPPC
The aforementioned model update and the simultaneous
changes in economic assumptions have increased the
estimated NPPC-at-risk. It has not changed much as a
result of the changed asset allocation. Nor is it expected
to change much as a result of the additional changes
planned for 2008. A lower Funded-Status-at-Risk does
not necessarily lead to a lower NPPC-at-Risk.
The country decomposition shows that the Dutch pension
fund contributes most to NPPC-at-risk. This is attributable
to its size and its exposure to equities.
In summary, the estimated Funded-Status-at-risk
decreased in 2007. NPPC-at-risk, on the other hand,
has hardly changed. The lower Funded-Status-at-risk
is attributable to the reduced asset-liability mismatch
of the Dutch pension fund. The Dutch pension fund still
contributes most to the risk statistics, due to its size and
its exposure to equities. Some further risk reduction may
be expected from the additional portfolio changes in the
Netherlands and the US to fully implement their new
investment strategies.
8 Financial highlights 10 Message from the President 16 The Philips Group 62 The Philips sectors