Philips 2007 Annual Report Download - page 131
Download and view the complete annual report
Please find page 131 of the 2007 Philips annual report below. You can navigate through the pages in the report by either clicking on the pages listed below, or by using the keyword search tool below to find specific information within the annual report.-
 1
1 -
2
-
3
-
4
-
5
-
6
-
7
-
8
-
9
-
10
-
11
-
12
-
13
-
14
-
15
-
16
-
17
-
18
-
19
-
20
-
21
-
22
-
23
-
24
-
25
-
26
-
27
-
28
-
29
-
30
-
31
-
32
-
33
-
34
-
35
-
36
-
37
-
38
-
39
-
40
-
41
-
42
-
43
-
44
-
45
-
46
-
47
-
48
-
49
-
50
-
51
-
52
-
53
-
54
-
55
-
56
-
57
-
58
-
59
-
60
-
61
-
62
-
63
-
64
-
65
-
66
-
67
-
68
-
69
-
70
-
71
-
72
-
73
-
74
-
75
-
76
-
77
-
78
-
79
-
80
-
81
-
82
-
83
-
84
-
85
-
86
-
87
-
88
-
89
-
90
-
91
-
92
-
93
-
94
-
95
-
96
-
97
-
98
-
99
-
100
-
101
-
102
-
103
-
104
-
105
-
106
-
107
-
108
-
109
-
110
-
111
-
112
-
113
-
114
-
115
-
116
-
117
-
118
-
119
-
120
-
 121
121 -
 122
122 -
 123
123 -
 124
124 -
 125
125 -
 126
126 -
 127
127 -
 128
128 -
 129
129 -
 130
130 -
 131
131 -
 132
132 -
 133
133 -
 134
134 -
 135
135 -
 136
136 -
 137
137 -
 138
138 -
 139
139 -
 140
140 -
 141
141 -
142
-
143
-
144
-
145
-
146
-
147
-
148
-
149
-
150
-
151
-
152
-
153
-
154
-
155
-
156
-
157
-
158
-
159
-
160
-
161
-
162
-
163
-
164
-
165
-
166
-
167
-
168
-
169
-
170
-
171
-
172
-
173
-
174
-
175
-
176
-
177
-
178
-
179
-
180
-
181
-
182
-
183
-
184
-
185
-
186
-
187
-
188
-
189
-
190
-
191
-
192
-
193
-
194
-
195
-
196
-
197
-
198
-
199
-
200
-
201
-
202
-
203
-
204
-
205
-
206
-
207
-
208
-
209
-
210
-
211
-
212
-
213
-
214
-
215
-
216
-
217
-
218
-
219
-
220
-
221
-
222
-
223
-
224
-
225
-
226
-
227
-
228
-
229
-
230
-
231
-
232
-
233
-
234
-
235
-
236
-
237
-
238
-
239
-
240
-
241
-
242
-
243
-
244
-
245
-
246
-
247
-
248
-
249
-
250
-
251
-
252
-
253
-
254
-
255
-
256
-
257
-
258
-
259
-
260
-
261
-
262
 |
 |

Philips Annual Report 2007 137
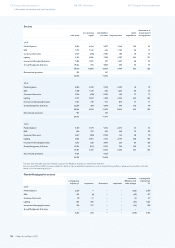
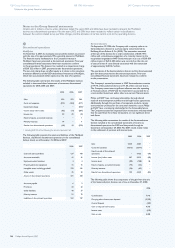
Information by sectors and main countries
in millions of euros unless otherwise stated
Sectors
sales
research and
development
expenses
income from
operations
income from
operations as a
% of sales
results relating
to equity-
accounted
investees
cash ow
before nancing
activities
2007
Medical Systems 6,470 (584) 743 11.5 7 420
DAP 2,968 (171) 510 17.2 − 415
Consumer Electronics 10,362 (321) 322 3.1 2 357
Lighting 6,093 (276) 675 11.1 − (648)
Innovation & Emerging Businesses 703 (598) (101) (14.4) (9) (348)
Group Management & Services 197 − (297) − 763 5,253
Inter-sector eliminations − 321 − − − −
26,793 (1,629) 1,852 6.9 763 5,449
2006
Medical Systems 6,448 (566) 734 11.4 9 (427)
DAP 2,532 (168) 370 14.6 − (287)
Consumer Electronics 10,576 (385) 313 3.0 3 248
Lighting 5,466 (269) 577 10.6 (4) 451
Innovation & Emerging Businesses 1,493 (577) (94) (6.3) (12) (625)
Group Management & Services 167 − (699) − (153) (1,832)
Inter-sector eliminations − 306 − − − −
26,682 (1,659) 1,201 4.5 (157) (2,472)
2005
Medical Systems 6,013 (517) 688 11.4 10 505
DAP 2,194 (139) 324 14.8 − 384
Consumer Electronics 10,422 (419) 404 3.9 2 548
Lighting 4,775 (212) 499 10.5 18 (236)
Innovation & Emerging Businesses 1,905 (587) (165) (8.7) (8) (96)
Group Management & Services 136 − (192) − 1,732 1,736
Inter-sector eliminations − 281 − − − −
25,445 (1,593) 1,558 6.1 1,754 2,841
The years 2005 and 2006 have been restated to present the MedQuist business as a discontinued operation. As of January 2007, the following key portfolio changes have
been applied to the Philips Group structure: Other Activities was renamed Innovation & Emerging Businesses; Unallocated was renamed Group Management & Services;
GSU activities and Miscellaneous were transferred from Innovation & Emerging Businesses to Group Management & Services; Consumer Healthcare Solutions was moved
from DAP to Innovation & Emerging Businesses. Also, of January 2007, certain Corporate/Regional/Country overhead and Corporate Intellectual Property costs were allocated
to the operating divisions to further improve transparency of the total cost structure. As a consequence of the aforementioned, prior-year nancials have been restated.
The following sectors are distinguished as reportable segments: Medical Systems, Domestic Appliances and Personal Care (DAP), Consumer
Electronics (CE), Lighting, Innovative & Emerging Businesses (I&EB) and Group Management & Services (GMS). A short description of these
sectors is as follows:
Medical Systems: Supplier of Imaging Systems, Ultrasound & Monitoring systems, Healthcare Informatics and Customer Services.
DAP: Markets a wide range of products in the areas of Shaving & Beauty, Domestic Appliances, Health & Wellness and Oral Healthcare.
CE: Provider of Connected Displays, Entertainment Solutions, Peripherals & Accessories, Home Networks and Optical Licenses.
Lighting: Consists of the following lines of business – Lamps, Luminaires, Lighting Electronics, Automotive, Special Lighting & UHP and Lumileds.
I&EB: Comprises various activities and businesses not belonging to a specic sector. It consists of Corporate Technologies (such as Research,
Intellectual Property & Standards, Applied Technologies and the Healthcare, Lifestyle and Technology Incubators), Corporate Investments and Other.
GMS: Includes overhead expenses in the corporate center and the cost of regional and country organizations. Also included are the costs of Philips’
global brand campaign and pension and other postretirement benet costs not directly allocated to the other sectors.
Group nancial statements Company nancial statements 250 Corporate governance246 Reconciliation of
non-US GAAP information 258 The Philips Group
in the last ten years 260
Investor information