Philips 2007 Annual Report Download - page 150
Download and view the complete annual report
Please find page 150 of the 2007 Philips annual report below. You can navigate through the pages in the report by either clicking on the pages listed below, or by using the keyword search tool below to find specific information within the annual report.-
 1
1 -
2
-
3
-
4
-
5
-
6
-
7
-
8
-
9
-
10
-
11
-
12
-
13
-
14
-
15
-
16
-
17
-
18
-
19
-
20
-
21
-
22
-
23
-
24
-
25
-
26
-
27
-
28
-
29
-
30
-
31
-
32
-
33
-
34
-
35
-
36
-
37
-
38
-
39
-
40
-
41
-
42
-
43
-
44
-
45
-
46
-
47
-
48
-
49
-
50
-
51
-
52
-
53
-
54
-
55
-
56
-
57
-
58
-
59
-
60
-
61
-
62
-
63
-
64
-
65
-
66
-
67
-
68
-
69
-
70
-
71
-
72
-
73
-
74
-
75
-
76
-
77
-
78
-
79
-
80
-
81
-
82
-
83
-
84
-
85
-
86
-
87
-
88
-
89
-
90
-
91
-
92
-
93
-
94
-
95
-
96
-
97
-
98
-
99
-
100
-
101
-
102
-
103
-
104
-
105
-
106
-
107
-
108
-
109
-
110
-
111
-
112
-
113
-
114
-
115
-
116
-
117
-
118
-
119
-
120
-
121
-
122
-
123
-
124
-
125
-
126
-
127
-
128
-
129
-
130
-
131
-
132
-
133
-
134
-
135
-
136
-
137
-
138
-
139
-
 140
140 -
 141
141 -
 142
142 -
 143
143 -
 144
144 -
 145
145 -
 146
146 -
 147
147 -
 148
148 -
 149
149 -
 150
150 -
 151
151 -
 152
152 -
 153
153 -
 154
154 -
 155
155 -
 156
156 -
 157
157 -
 158
158 -
 159
159 -
 160
160 -
161
-
162
-
163
-
164
-
165
-
166
-
167
-
168
-
169
-
170
-
171
-
172
-
173
-
174
-
175
-
176
-
177
-
178
-
179
-
180
-
181
-
182
-
183
-
184
-
185
-
186
-
187
-
188
-
189
-
190
-
191
-
192
-
193
-
194
-
195
-
196
-
197
-
198
-
199
-
200
-
201
-
202
-
203
-
204
-
205
-
206
-
207
-
208
-
209
-
210
-
211
-
212
-
213
-
214
-
215
-
216
-
217
-
218
-
219
-
220
-
221
-
222
-
223
-
224
-
225
-
226
-
227
-
228
-
229
-
230
-
231
-
232
-
233
-
234
-
235
-
236
-
237
-
238
-
239
-
240
-
241
-
242
-
243
-
244
-
245
-
246
-
247
-
248
-
249
-
250
-
251
-
252
-
253
-
254
-
255
-
256
-
257
-
258
-
259
-
260
-
261
-
262
 |
 |

Philips Annual Report 2007156
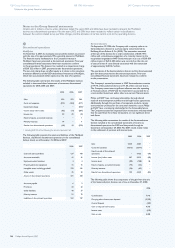
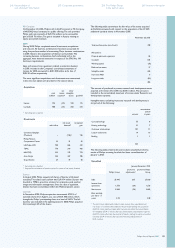
The effective tax rate is lower than the weighted average statutory
income tax rate in 2007, mainly due to non-taxable income related
to dividend and the sale of shares of TSMC, and releases in the valuation
allowance due to re-assessment by management, which is partly offset
by reductions of deferred tax assets due to tax rate changes, and
by ‘other’ including re-assessment of uncertain tax positions and
of prior-year tax returns.
Deferred tax assets and liabilities
Deferred tax assets and liabilities relate to the following balance
sheet captions:
2006 2007
assets
liabilities
assets
liabilities
Intangible assets 97 (330) 110 (298)
Property, plant and equipment 90 (60) 126 (55)
Inventories 158 (20) 164 (47)
Prepaid pension costs 10 (590) 18 (784)
Other receivables 70 (20) 52 (9)
Other assets 420 (20) 58 (34)
Provisions:
- Pensions 383 (63) 444 (9)
- Restructuring 20 − − −
- Guarantees 10 − 13 −
- Termination benets 20 − 19 −
- Other postretirement benets 100 − 147 −
- Other provisions 460 (140) 368 (277)
Other 169 (25) 192 (35)
Total deferred tax assets/liabilities 2,007 (1,268) 1,711 (1,548)
Tax loss carryforwards (including
tax credit carryforwards) 1,000 1,014
Net deferred tax position 1,739 1,177
Valuation allowances (721) (494)
Net deferred tax assets 1,018 683
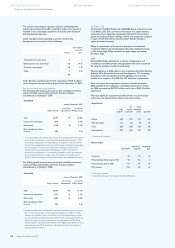
In assessing the realizability of deferred tax assets, management considers
whether it is more likely than not that some portion or all of the
deferred tax assets will not be realized. The ultimate realization of
deferred tax assets is dependent upon the generation of future taxable
income during the periods in which those temporary differences become
deductible. Management considers the scheduled reversal of deferred
tax liabilities, projected future taxable income and tax planning
strategies in making this assessment. In order to fully realize the
deferred tax assets arising from net operating losses, the Company
will need to generate future taxable income in the countries where
the net operating losses were incurred. Based upon the level of
historical taxable income and projections for future taxable income
over the periods in which the deferred tax assets are deductible,
management believes, as at December 31, 2007, it is more likely than
not that the Company will realize the benets of these deductible
differences, net of the existing valuation allowance.
The valuation allowance for deferred tax assets was EUR 494 million
and EUR 721 million as of December 31, 2007 and 2006, respectively.
The net changes in the total valuation allowance, due to re-assessement
by management, were a decrease of EUR 227 million, a decrease
of EUR 214 million and an increase of EUR 40 million for the years
ended December 31, 2007, 2006 and 2005, respectively.
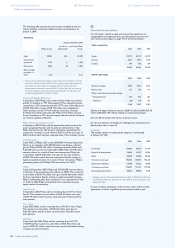
At December 31, 2007, operating loss carryforwards expire as follows:
Total 2008 2009 2010 2011 2012
2013/
2017 later
un-
limited
4,496 8 11 5 14 10 6 884 3,558
The Company also has tax credit carryforwards of EUR 77 million,
which are available to offset future tax, if any, and which expire
as follows:
Total 2008 2009 2010 2011 2012
2013/
2017 later
un-
limited
77 1 1 − 2 4 5 25 39
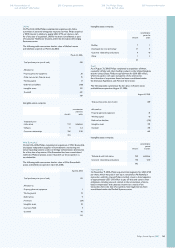
Classication of the deferred tax assets and liabilities is as follows:
2006 2007
Deferred tax assets − under other current assets 489 399
Deferred tax assets − under other non-current assets
1,138 971
Deferred tax liabilities − under provisions (609) (687)
1,018 683
Classication of the income tax payable and receivable is as follows:
2006 2007
Income tax receivable − under current receivables 105 52
Income tax receivable − under non-current receivables 25 14
Income tax payable − under accrued liabilities (519) (154)
Income tax payable − under non-current liabilities (36) (1)
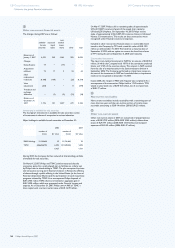
Uncertain tax positions
The Company adopted the provisions of FASB Interpretation No. 48,
Accounting for Uncertainty in Income Taxes, on January 1, 2007.
As a result of the implementation of FIN 48, the Company reassessed
its tax positions and concluded that no cumulative-effect adjustment
relating to adopting FIN 48 is required on January 1, 2007.
A reconciliation of the beginning and ending amount of unrecognized
tax benets is as follows:
Balance January 1, 2007 719
Additions based on tax positions related to the current year 116
Additions for tax positions of prior years 23
Reductions for tax positions of prior years for:
- Change in judgment (28)
- Settlement during the period (159)
- Lapses of applicable statute of limitation (1)
- Currency differences (43)
Balance at December 31, 2007 627
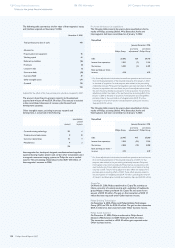
The estimated timing of cash payments associated with unrecognized
tax positions amounting to EUR 627 million is not reliably estimable.
The total amount of unrecognized tax benets that, if recognized, would
affect the effective tax rate is EUR 577 million.
Unrecognized tax benets including interest and penalties are accounted
for as follows:
Netted against deferred tax assets 143
Netted against income tax receivable 100
Non-current portion of other liabilities 429
128 Group nancial statements
Notes to the group nancial statements
188 IFRS information 240 Company nancial statements