Philips 2007 Annual Report Download - page 218
Download and view the complete annual report
Please find page 218 of the 2007 Philips annual report below. You can navigate through the pages in the report by either clicking on the pages listed below, or by using the keyword search tool below to find specific information within the annual report.-
 1
1 -
2
-
3
-
4
-
5
-
6
-
7
-
8
-
9
-
10
-
11
-
12
-
13
-
14
-
15
-
16
-
17
-
18
-
19
-
20
-
21
-
22
-
23
-
24
-
25
-
26
-
27
-
28
-
29
-
30
-
31
-
32
-
33
-
34
-
35
-
36
-
37
-
38
-
39
-
40
-
41
-
42
-
43
-
44
-
45
-
46
-
47
-
48
-
49
-
50
-
51
-
52
-
53
-
54
-
55
-
56
-
57
-
58
-
59
-
60
-
61
-
62
-
63
-
64
-
65
-
66
-
67
-
68
-
69
-
70
-
71
-
72
-
73
-
74
-
75
-
76
-
77
-
78
-
79
-
80
-
81
-
82
-
83
-
84
-
85
-
86
-
87
-
88
-
89
-
90
-
91
-
92
-
93
-
94
-
95
-
96
-
97
-
98
-
99
-
100
-
101
-
102
-
103
-
104
-
105
-
106
-
107
-
108
-
109
-
110
-
111
-
112
-
113
-
114
-
115
-
116
-
117
-
118
-
119
-
120
-
121
-
122
-
123
-
124
-
125
-
126
-
127
-
128
-
129
-
130
-
131
-
132
-
133
-
134
-
135
-
136
-
137
-
138
-
139
-
140
-
141
-
142
-
143
-
144
-
145
-
146
-
147
-
148
-
149
-
150
-
151
-
152
-
153
-
154
-
155
-
156
-
157
-
158
-
159
-
160
-
161
-
162
-
163
-
164
-
165
-
166
-
167
-
168
-
169
-
170
-
171
-
172
-
173
-
174
-
175
-
176
-
177
-
178
-
179
-
180
-
181
-
182
-
183
-
184
-
185
-
186
-
187
-
188
-
189
-
190
-
191
-
192
-
193
-
194
-
195
-
196
-
197
-
198
-
199
-
200
-
201
-
202
-
203
-
204
-
205
-
206
-
207
-
 208
208 -
 209
209 -
 210
210 -
 211
211 -
 212
212 -
 213
213 -
 214
214 -
 215
215 -
 216
216 -
 217
217 -
 218
218 -
 219
219 -
 220
220 -
 221
221 -
 222
222 -
 223
223 -
 224
224 -
 225
225 -
 226
226 -
 227
227 -
 228
228 -
229
-
230
-
231
-
232
-
233
-
234
-
235
-
236
-
237
-
238
-
239
-
240
-
241
-
242
-
243
-
244
-
245
-
246
-
247
-
248
-
249
-
250
-
251
-
252
-
253
-
254
-
255
-
256
-
257
-
258
-
259
-
260
-
261
-
262
 |
 |

Philips Annual Report 2007224
44
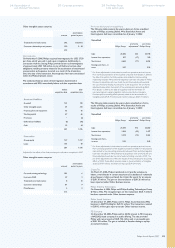
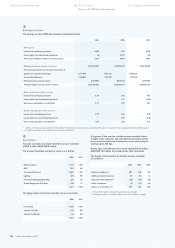
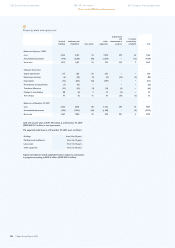
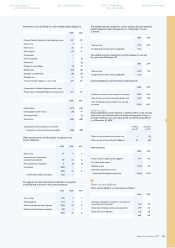
Earnings per share
The earnings per share (EPS) data have been calculated as follows:
2005 2006 2007
Net income
Income from continuing operations 3,380 654 4,728
Income (loss) from discontinued operations (6) 4,010 (73)
Net income available to holders of common shares 3,374 4,664 4,655
Weighted average number of shares 1,249,955,546 1,174,924,579 1,086,128,418
Plus incremental shares from assumed conversions of:
Options and restricted share rights 2,771,955 7,531,636 11,669,275
Convertible debentures 602,863 1,174,299 1,127,690
Dilutive potential common shares1) 3,374,818 8,705,935 12,796,965
Adjusted weighted average number of shares 1,253,330,364 1,183,630,514 1,098,925,383
Basic earnings per share in euros
Income from continuing operations 2.70 0.56 4.35
Income (loss) from discontinued operations − 3.41 (0.06)
Net income attributable to stockholders 2.70 3.97 4.29
Diluted earnings per share in euros
Income from continuing operations 2.70 0.55 4.30
Income (loss) from discontinued operations − 3.39 (0.06)
Net income attributable to stockholders 2.70 3.94 4.24
1) In 2007, 27 million securities (2006: 19 million, 2005: 34 million) that could potentially dilute basic EPS were not included in the computation of dilutive EPS because
the effect would have been antidilutive for the periods presented.
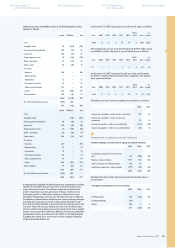
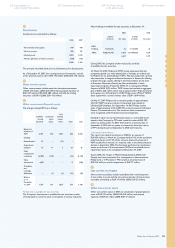
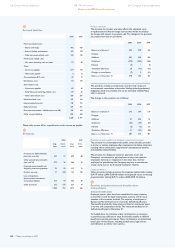
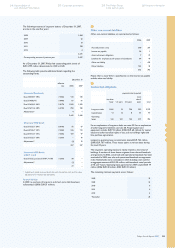
45
Receivables
Accounts receivable, net, include installment accounts receivable
of EUR 3 million (2006: EUR 8 million).
The accounts receivable, net, split per sector are as follows:
2006 2007
Medical Systems 1,341 1,403
DAP 250 303
Consumer Electronics 1,467 1,467
Lighting 675 796
Innovation & Emerging Businesses 226 173
Group Management & Services 298 67
4,257 4,209
The ageing analysis of accounts receivable, net, is set out below:
2006 2007
not overdue 3,698 3,453
overdue 1-30 days 416 495
overdue 31-180 days 143 261
4,257 4,209
A large part of the overdues of trade accounts receivable relates
to public sector customers with slow payment approval processes
but no or limited credit risk. Provisions have been made mainly for
overdues above 180 days.
Income taxes receivable (current portion) totaling EUR 52 million
(2006: EUR 105 million) are included under other receivables.
The changes in the allowance for doubtful accounts receivable
are as follows:
2005 2006 2007
Balance as of January 1 404 369 336
Additions charged to income 30 52 62
Deductions from allowance1) (62) (72) (85)
Other movements2) (3) (13) (13)
Balance as of December 31 369 336 300
1) Write-offs for which an allowance was previously provided
2) Including the effect of translation differences and consolidation changes
128 Group nancial statements 188 IFRS information
Notes to the IFRS nancial statements
240 Company nancial statements