Philips 2007 Annual Report Download - page 31
Download and view the complete annual report
Please find page 31 of the 2007 Philips annual report below. You can navigate through the pages in the report by either clicking on the pages listed below, or by using the keyword search tool below to find specific information within the annual report.-
 1
1 -
2
-
3
-
4
-
5
-
6
-
7
-
8
-
9
-
10
-
11
-
12
-
13
-
14
-
15
-
16
-
17
-
18
-
19
-
20
-
 21
21 -
 22
22 -
 23
23 -
 24
24 -
 25
25 -
 26
26 -
 27
27 -
 28
28 -
 29
29 -
 30
30 -
 31
31 -
 32
32 -
 33
33 -
 34
34 -
 35
35 -
 36
36 -
 37
37 -
 38
38 -
 39
39 -
 40
40 -
 41
41 -
42
-
43
-
44
-
45
-
46
-
47
-
48
-
49
-
50
-
51
-
52
-
53
-
54
-
55
-
56
-
57
-
58
-
59
-
60
-
61
-
62
-
63
-
64
-
65
-
66
-
67
-
68
-
69
-
70
-
71
-
72
-
73
-
74
-
75
-
76
-
77
-
78
-
79
-
80
-
81
-
82
-
83
-
84
-
85
-
86
-
87
-
88
-
89
-
90
-
91
-
92
-
93
-
94
-
95
-
96
-
97
-
98
-
99
-
100
-
101
-
102
-
103
-
104
-
105
-
106
-
107
-
108
-
109
-
110
-
111
-
112
-
113
-
114
-
115
-
116
-
117
-
118
-
119
-
120
-
121
-
122
-
123
-
124
-
125
-
126
-
127
-
128
-
129
-
130
-
131
-
132
-
133
-
134
-
135
-
136
-
137
-
138
-
139
-
140
-
141
-
142
-
143
-
144
-
145
-
146
-
147
-
148
-
149
-
150
-
151
-
152
-
153
-
154
-
155
-
156
-
157
-
158
-
159
-
160
-
161
-
162
-
163
-
164
-
165
-
166
-
167
-
168
-
169
-
170
-
171
-
172
-
173
-
174
-
175
-
176
-
177
-
178
-
179
-
180
-
181
-
182
-
183
-
184
-
185
-
186
-
187
-
188
-
189
-
190
-
191
-
192
-
193
-
194
-
195
-
196
-
197
-
198
-
199
-
200
-
201
-
202
-
203
-
204
-
205
-
206
-
207
-
208
-
209
-
210
-
211
-
212
-
213
-
214
-
215
-
216
-
217
-
218
-
219
-
220
-
221
-
222
-
223
-
224
-
225
-
226
-
227
-
228
-
229
-
230
-
231
-
232
-
233
-
234
-
235
-
236
-
237
-
238
-
239
-
240
-
241
-
242
-
243
-
244
-
245
-
246
-
247
-
248
-
249
-
250
-
251
-
252
-
253
-
254
-
255
-
256
-
257
-
258
-
259
-
260
-
261
-
262
 |
 |

Philips Annual Report 2007 37
Medical Systems’ growth (3.6%) was led by Ultrasound &
Monitoring and Customer Services. Overall sales growth
was tempered by a decline at Imaging Systems, primarily
due to a softening of the market in the US (including the
effect of the Decit Reduction Act) and Japan. At CE, the
sales increase (1.0%) was driven by all businesses, except
Connected Displays, which lost market share in the rst
half of 2007, and was faced with erce competition and
price pressure in the Flat TV segment, particularly in the US.
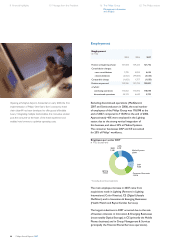
Earnings
In 2007, Philips’ gross margin of EUR 9,169 million, or 34.2%
of sales, represented an improvement of EUR 919 million
compared to 2006 (EUR 8,250 million, or 30.9%). Adjusted
for the product liability charge in 2006 (EUR 256 million),
gross margin improved from 31.9% of sales to 34.2%.
This improvement was primarily driven by higher gross
margins at Medical Systems and Lighting.
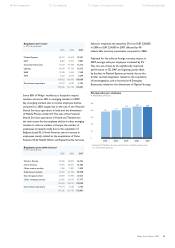
Selling expenses increased from EUR 4,655 million in
2006 to EUR 4,980 million in 2007, largely due to higher
expenditures at Lighting and DAP, both partly related to
acquisitions and higher sales. As a percentage of sales,
selling expenses increased from 17.4% in 2006 to 18.6%
in 2007, mainly attributable to Lighting (mostly due to
acquisitions) and Medical Systems.
Research and development costs (EUR 1,629 million, or
6.1% of sales) declined slightly compared to 2006 (EUR
1,659 million, or 6.2% of sales), as lower expenditures at
CE, mainly related to the divestment of Mobile Phones,
offset increased investments in Medical Systems, Lighting,
DAP and Innovation & Emerging Businesses.
General and administrative expenses (EUR 854 million)
declined by 12% compared to 2006 (EUR 969 million),
largely as a result of lower pension costs and reduced
overhead costs in corporate and regional organizations,
following the simplication of the regional management
structure. As a percentage of sales, G&A costs declined
from 3.6% in 2006 to 3.2% in 2007.
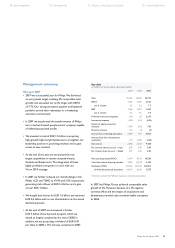
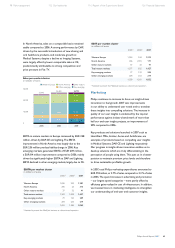
The following overview shows sales, EBIT and EBITA
according to the 2007 sector classication.
Sales, EBIT and EBITA 2007
in millions of euros unless otherwise stated
sales EBIT % EBITA %
Medical Systems 6,470 743 11.5 875 13.5
DAP 2,968 510 17.2 523 17.6
Consumer Electronics 10,362 322 3.1 325 3.1
Lighting 6,093 675 11.1 722 11.9
I&EB 703 (101) (14.4) (83) (11.8)
GMS 197 (297) − (297) −
Philips Group 26,793 1,852 6.9 2,065 7.7
Sales, EBIT and EBITA 20061)
in millions of euros unless otherwise stated
sales EBIT % EBITA %
Medical Systems 6,448 734 11.4 861 13.4
DAP 2,532 370 14.6 378 14.9
Consumer Electronics 10,576 313 3.0 314 3.0
Lighting 5,466 577 10.6 608 11.1
I&EB 1,493 (94) (6.3) (76) (5.1)
GMS 167 (699) − (699) −
Philips Group 26,682 1,201 4.5 1,386 5.2
1) Restated to present the MedQuist business as a discontinued operation
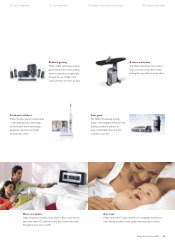
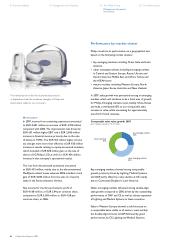
Philips Satinelle Ice is gentle for delicate skin and sensitive body
areas thanks to a hypoallergenic ceramic epilating system and a
detachable ice cooler.
98 Risk management 112 Our leadership 116 Report of the Supervisory Board 126 Financial Statements