Philips 2007 Annual Report Download - page 132
Download and view the complete annual report
Please find page 132 of the 2007 Philips annual report below. You can navigate through the pages in the report by either clicking on the pages listed below, or by using the keyword search tool below to find specific information within the annual report.-
 1
1 -
2
-
3
-
4
-
5
-
6
-
7
-
8
-
9
-
10
-
11
-
12
-
13
-
14
-
15
-
16
-
17
-
18
-
19
-
20
-
21
-
22
-
23
-
24
-
25
-
26
-
27
-
28
-
29
-
30
-
31
-
32
-
33
-
34
-
35
-
36
-
37
-
38
-
39
-
40
-
41
-
42
-
43
-
44
-
45
-
46
-
47
-
48
-
49
-
50
-
51
-
52
-
53
-
54
-
55
-
56
-
57
-
58
-
59
-
60
-
61
-
62
-
63
-
64
-
65
-
66
-
67
-
68
-
69
-
70
-
71
-
72
-
73
-
74
-
75
-
76
-
77
-
78
-
79
-
80
-
81
-
82
-
83
-
84
-
85
-
86
-
87
-
88
-
89
-
90
-
91
-
92
-
93
-
94
-
95
-
96
-
97
-
98
-
99
-
100
-
101
-
102
-
103
-
104
-
105
-
106
-
107
-
108
-
109
-
110
-
111
-
112
-
113
-
114
-
115
-
116
-
117
-
118
-
119
-
120
-
121
-
 122
122 -
 123
123 -
 124
124 -
 125
125 -
 126
126 -
 127
127 -
 128
128 -
 129
129 -
 130
130 -
 131
131 -
 132
132 -
 133
133 -
 134
134 -
 135
135 -
 136
136 -
 137
137 -
 138
138 -
 139
139 -
 140
140 -
 141
141 -
 142
142 -
143
-
144
-
145
-
146
-
147
-
148
-
149
-
150
-
151
-
152
-
153
-
154
-
155
-
156
-
157
-
158
-
159
-
160
-
161
-
162
-
163
-
164
-
165
-
166
-
167
-
168
-
169
-
170
-
171
-
172
-
173
-
174
-
175
-
176
-
177
-
178
-
179
-
180
-
181
-
182
-
183
-
184
-
185
-
186
-
187
-
188
-
189
-
190
-
191
-
192
-
193
-
194
-
195
-
196
-
197
-
198
-
199
-
200
-
201
-
202
-
203
-
204
-
205
-
206
-
207
-
208
-
209
-
210
-
211
-
212
-
213
-
214
-
215
-
216
-
217
-
218
-
219
-
220
-
221
-
222
-
223
-
224
-
225
-
226
-
227
-
228
-
229
-
230
-
231
-
232
-
233
-
234
-
235
-
236
-
237
-
238
-
239
-
240
-
241
-
242
-
243
-
244
-
245
-
246
-
247
-
248
-
249
-
250
-
251
-
252
-
253
-
254
-
255
-
256
-
257
-
258
-
259
-
260
-
261
-
262
 |
 |

Philips Annual Report 2007138
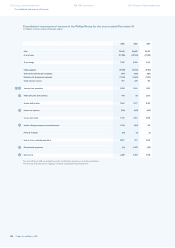
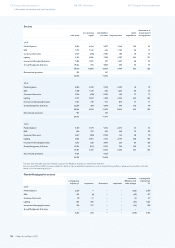
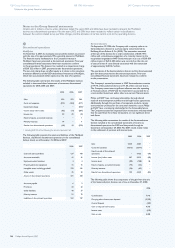
Sectors
total assets
net operating
capital
total liabilities
excl. debt long-lived assets
capital
expenditures
depreciation of
property, plant
and equipment
2007
Medical Systems 6,033 4,104 1,877 3,264 150 81
DAP 1,779 1,136 643 1,109 86 77
Consumer Electronics 2,534 (246) 2,780 183 78 79
Lighting 5,133 3,886 1,238 3,307 249 217
Innovation & Emerging Businesses 1,409 1,001 297 1,001 68 49
Group Management & Services 19,122 705 4,068 605 30 59
36,010 10,586 10,903 9,469 661 562
Discontinued operations 333 157
36,343 11,060
2006
Medical Systems 6,096 4,125 1,922 3,503 76 72
DAP 1,768 1,138 630 1,204 84 69
Consumer Electronics 2,516 (228) 2,735 149 72 71
Lighting 3,719 2,527 1,185 2,244 343 205
Innovation & Emerging Businesses 1,431 748 512 874 14 71
Group Management & Services 22,536 208 4,438 646 105 66
38,066 8,518 11,422 8,620 694 554
Discontinued operations 431 169
38,497 11,591
2005
Medical Systems 5,160 3,179 1,942 2,673 65 64
DAP 896 370 526 449 73 85
Consumer Electronics 2,657 (296) 2,939 154 68 70
Lighting 3,642 2,491 1,132 2,196 206 164
Innovation & Emerging Businesses 1,072 226 2,406 324 80 102
Group Management & Services 15,994 (531) 2,122 744 145 57
29,421 5,439 11,067 6,540 637 542
Discontinued operations 4,484 1,627
33,905 12,694
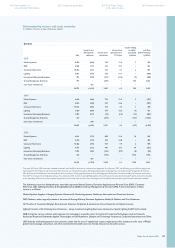
The years 2005 and 2006 have been restated to present the MedQuist business as a discontinued operation.
Also, the years 2005 and 2006 have been restated to reect certain reclassications between the sectors related to: key portfolio changes, and the allocation of certain
central cost to the operating divisions.
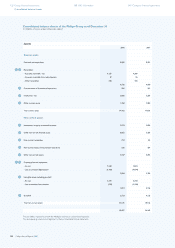
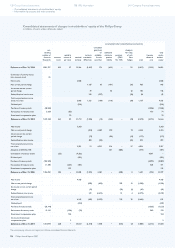
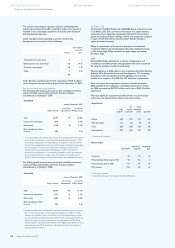
Goodwill assigned to sectors
carrying value
at January 1 acquisitions divestments impairment
translation
differences and
other changes
carrying value
at December
31
2007
Medical Systems 2,290 1 − − (233) 2,058
DAP 463 (4) − − (42) 417
Consumer Electronics 18 11 − − (2) 27
Lighting 636 695 − − (87) 1,244
Innovation & Emerging Businesses 316 107 − − (34) 389
Group Management & Services − − − − − −
3,723 810 − − (398) 4,135
128 Group nancial statements
Information by sectors and main countries
188 IFRS information 240 Company nancial statements