Philips 2007 Annual Report Download - page 186
Download and view the complete annual report
Please find page 186 of the 2007 Philips annual report below. You can navigate through the pages in the report by either clicking on the pages listed below, or by using the keyword search tool below to find specific information within the annual report.-
 1
1 -
2
-
3
-
4
-
5
-
6
-
7
-
8
-
9
-
10
-
11
-
12
-
13
-
14
-
15
-
16
-
17
-
18
-
19
-
20
-
21
-
22
-
23
-
24
-
25
-
26
-
27
-
28
-
29
-
30
-
31
-
32
-
33
-
34
-
35
-
36
-
37
-
38
-
39
-
40
-
41
-
42
-
43
-
44
-
45
-
46
-
47
-
48
-
49
-
50
-
51
-
52
-
53
-
54
-
55
-
56
-
57
-
58
-
59
-
60
-
61
-
62
-
63
-
64
-
65
-
66
-
67
-
68
-
69
-
70
-
71
-
72
-
73
-
74
-
75
-
76
-
77
-
78
-
79
-
80
-
81
-
82
-
83
-
84
-
85
-
86
-
87
-
88
-
89
-
90
-
91
-
92
-
93
-
94
-
95
-
96
-
97
-
98
-
99
-
100
-
101
-
102
-
103
-
104
-
105
-
106
-
107
-
108
-
109
-
110
-
111
-
112
-
113
-
114
-
115
-
116
-
117
-
118
-
119
-
120
-
121
-
122
-
123
-
124
-
125
-
126
-
127
-
128
-
129
-
130
-
131
-
132
-
133
-
134
-
135
-
136
-
137
-
138
-
139
-
140
-
141
-
142
-
143
-
144
-
145
-
146
-
147
-
148
-
149
-
150
-
151
-
152
-
153
-
154
-
155
-
156
-
157
-
158
-
159
-
160
-
161
-
162
-
163
-
164
-
165
-
166
-
167
-
168
-
169
-
170
-
171
-
172
-
173
-
174
-
175
-
 176
176 -
 177
177 -
 178
178 -
 179
179 -
 180
180 -
 181
181 -
 182
182 -
 183
183 -
 184
184 -
 185
185 -
 186
186 -
 187
187 -
 188
188 -
 189
189 -
 190
190 -
 191
191 -
 192
192 -
 193
193 -
 194
194 -
 195
195 -
 196
196 -
197
-
198
-
199
-
200
-
201
-
202
-
203
-
204
-
205
-
206
-
207
-
208
-
209
-
210
-
211
-
212
-
213
-
214
-
215
-
216
-
217
-
218
-
219
-
220
-
221
-
222
-
223
-
224
-
225
-
226
-
227
-
228
-
229
-
230
-
231
-
232
-
233
-
234
-
235
-
236
-
237
-
238
-
239
-
240
-
241
-
242
-
243
-
244
-
245
-
246
-
247
-
248
-
249
-
250
-
251
-
252
-
253
-
254
-
255
-
256
-
257
-
258
-
259
-
260
-
261
-
262
 |
 |

Philips Annual Report 2007192
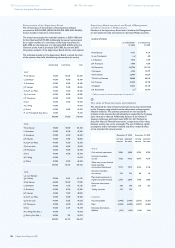
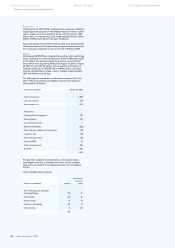
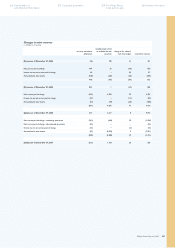
Key data CE
in millions of euros unless otherwise stated
2005 2006 2007
Sales 10,422 10,576 10,362
% increase (decrease), nominal 5 1 (2)
% increase, comparable 5 5 1
EBITA 426 300 315
as % of sales 4.1 2.8 3.0
EBIT 425 299 312
as a % of sales 4.1 2.8 3.0
Net operating capital (NOC) (200) (134) (157)
Cash ows before nancing activities 548 248 339
Employees (FTEs) 15,537 14,486 13,516
Sales totaled EUR 10,362 million in 2007, reecting a nominal decline
of 2% compared to 2006. Adjusted for 1% portfolio changes (mainly
the sale of Mobile Phones in March 2007 and the acquisition of DLO
in May 2007) and 2% negative currency effects, comparable sales
increased by 1%. Year-on-year sales growth was delivered by all
businesses except Connected Displays, which suffered from challenging
market conditions and a loss of market share in the rst half of the
year. The sales decline at Connected Displays was due to the positive
effect, in 2006, of soccer’s World Cup, as well as increased competition
and price pressure in Flat TV, the latter particularly in the US.
However, in the second half of the year Connected Displays showed
10% comparable growth.
From a geographical perspective, sales growth was strong in Europe
and the emerging markets in Asia Pacic, driven by all businesses.
Sales declined in North America and Latin America, primarily due
to Connected Displays.
CE’s focus on margin management resulted in an EBITA of EUR 315
million, or 3.0% of sales, compared to 2.8% in 2006, in line with the
target set for the division. Signicant margin pressure at Connected
Displays, particularly in the US, was more than offset by higher EBITA
in the other businesses.
EBIT reached EUR 312 million (3.0% of sales), compared to EUR 299
million (2.8% of sales) in 2006.
Net operating capital at the end of 2007 amounted to negative EUR 157
million (2006: negative EUR 134 million), reecting the continued success
of the division’s asset-light strategy. Cash ows before nancing
activities improved from EUR 248 million in 2006 to EUR 339 million
in 2007, primarily driven by tight working capital management at
Connected Displays.
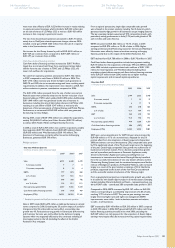
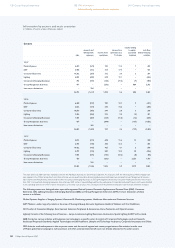
Key data Lighting
in millions of euros unless otherwise stated
2005 2006 2007
Sales 4,775 5,466 6,093
% increase, nominal 6 14 11
% increase, comparable 4 8 6
EBITA 503 547 665
as % of sales 10.5 10.0 10.9
EBIT 500 516 618
as a % of sales 10.5 9.4 10.1
Net operating capital (NOC) 2,846 2,817 4,059
Cash ows before nancing activities (236) 451 (644)
Employees (FTEs) 45,649 47,739 54,323
Lighting sales grew 11% in nominal terms in 2007, supported by the
contribution of the acquired companies PLI and Color Kinetics.
Excluding these acquisitions and the negative currency impact of 3%,
comparable growth amounted to 6%, led by robust growth of energy-
efcient lighting, primarily within Lamps and Luminaires. Sales of Solid-
State Lighting applications grew 281% year-on-year, reaching EUR 160
million, helped by the acquisition of Color Kinetics. Automotive
Lighting and Lighting Electronics also achieved comparable growth.
However, the remaining businesses showed comparable declines,
mainly due to the contracting rear-projection TV market (Special
Lighting Applications).
Geographically, the division showed strong growth in all market
clusters except North America. Emerging markets delivered particularly
strong growth of 17% in currency-comparable terms, attributable
to solid growth across all businesses except for Special Lighting
Applications in Asia, related to the rapid contraction of the rear-
projection TV market. Sales growth was notably strong in China (18%)
and India (16%).
EBITA in 2007 amounted to EUR 665 million, growing by EUR 118
million year-on-year to reach 10.9% of sales, compared to EUR 547
million, or 10.0% of sales, in 2006. This improvement was driven by
solid earnings growth at Lamps and Luminaires, additional EBITA
following the successful integration of PLI, and lower losses related
to the uorescent-based backlighting solutions business which we
exited in Q1 2007.
EBIT improved by EUR 102 million to reach EUR 618 million,
or 10.1% of sales.
Cash ows before nancing included acquisition-related investments
totaling EUR 1,162 million in 2007, most notably net payments of
EUR 561 million for Partners in Lighting and of EUR 515 million for
Color Kinetics. Net capital expenditures declined by EUR 87 million
compared to 2006, mainly due to higher investments in Lumileds in 2006.
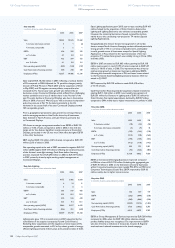
Key data I&EB
in millions of euros unless otherwise stated
2005 2006 2007
Sales 1,905 1,493 703
% decrease, nominal (18) (22) (53)
% increase (decrease), comparable (5) (9) 32
EBITA (195) (146) (118)
as % of sales (10.2) (9.8) (16.8)
EBIT (195) (164) (136)
as a % of sales (10.2) (11.0) (19.3)
Net operating capital (NOC) 302 791 1,021
Cash ows before nancing activities (96) (625) (440)
Employees (FTEs) 15,130 9,852 7,638
EBITA at Innovation & Emerging Businesses improved compared
to 2006, to a loss of EUR 118 million. Excluding the aggregated gain
of EUR 35 million in 2006 on the divestment of several businesses
within Corporate Investments (most notably PSS, ETG and PBC) and
Corporate Technologies (CryptoTec), EBITA improved by EUR 63
million, mainly due to higher license income.
Key data GMS
in millions of euros unless otherwise stated
2005 2006 2007
Sales 136 167 197
EBITA (262) (844) (556)
EBIT (262) (844) (556)
Net operating capital (NOC) (2,252) (1,415) (1,423)
Cash ows before nancing activities 1,736 (1,832) 5,373
Employees (FTEs) 6,312 6,879 5,299
EBITA at Group Management & Services improved by EUR 288 million
compared to 2006, when the EUR 182 million asbestos-related
product liability charge was recognized. The improvement in EBITA
was also driven by a reduction in Corporate, Country & Regional
overheads and reduced investments in the brand campaign.
128 Group nancial statements 188 IFRS information
IFRS management commentary
240 Company nancial statements