Philips 2007 Annual Report Download - page 211
Download and view the complete annual report
Please find page 211 of the 2007 Philips annual report below. You can navigate through the pages in the report by either clicking on the pages listed below, or by using the keyword search tool below to find specific information within the annual report.-
 1
1 -
2
-
3
-
4
-
5
-
6
-
7
-
8
-
9
-
10
-
11
-
12
-
13
-
14
-
15
-
16
-
17
-
18
-
19
-
20
-
21
-
22
-
23
-
24
-
25
-
26
-
27
-
28
-
29
-
30
-
31
-
32
-
33
-
34
-
35
-
36
-
37
-
38
-
39
-
40
-
41
-
42
-
43
-
44
-
45
-
46
-
47
-
48
-
49
-
50
-
51
-
52
-
53
-
54
-
55
-
56
-
57
-
58
-
59
-
60
-
61
-
62
-
63
-
64
-
65
-
66
-
67
-
68
-
69
-
70
-
71
-
72
-
73
-
74
-
75
-
76
-
77
-
78
-
79
-
80
-
81
-
82
-
83
-
84
-
85
-
86
-
87
-
88
-
89
-
90
-
91
-
92
-
93
-
94
-
95
-
96
-
97
-
98
-
99
-
100
-
101
-
102
-
103
-
104
-
105
-
106
-
107
-
108
-
109
-
110
-
111
-
112
-
113
-
114
-
115
-
116
-
117
-
118
-
119
-
120
-
121
-
122
-
123
-
124
-
125
-
126
-
127
-
128
-
129
-
130
-
131
-
132
-
133
-
134
-
135
-
136
-
137
-
138
-
139
-
140
-
141
-
142
-
143
-
144
-
145
-
146
-
147
-
148
-
149
-
150
-
151
-
152
-
153
-
154
-
155
-
156
-
157
-
158
-
159
-
160
-
161
-
162
-
163
-
164
-
165
-
166
-
167
-
168
-
169
-
170
-
171
-
172
-
173
-
174
-
175
-
176
-
177
-
178
-
179
-
180
-
181
-
182
-
183
-
184
-
185
-
186
-
187
-
188
-
189
-
190
-
191
-
192
-
193
-
194
-
195
-
196
-
197
-
198
-
199
-
200
-
 201
201 -
 202
202 -
 203
203 -
 204
204 -
 205
205 -
 206
206 -
 207
207 -
 208
208 -
 209
209 -
 210
210 -
 211
211 -
 212
212 -
 213
213 -
 214
214 -
 215
215 -
 216
216 -
 217
217 -
 218
218 -
 219
219 -
 220
220 -
 221
221 -
222
-
223
-
224
-
225
-
226
-
227
-
228
-
229
-
230
-
231
-
232
-
233
-
234
-
235
-
236
-
237
-
238
-
239
-
240
-
241
-
242
-
243
-
244
-
245
-
246
-
247
-
248
-
249
-
250
-
251
-
252
-
253
-
254
-
255
-
256
-
257
-
258
-
259
-
260
-
261
-
262
 |
 |

Philips Annual Report 2007 217
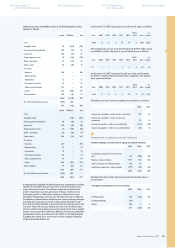
The following table presents the year-to-date unaudited results of
Lumileds and the effect on Philips’ results assuming Lumileds had been
consolidated as of January 1, 2004:
Unaudited
January-December 2004
Philips
Group
pro forma
adjustments1)
pro forma
Philips Group
Sales 24,855 234 25,089
Income from operations 1,105 (34) 1,071
Net income 2,783 (30) 2,753
Earnings per share - in
euros 2.17 2.15
1) The pro forma adjustments relate to sales, income from operations and net
results of Lumileds of 2004 (EUR 52 million positive impact after tax) and also
reect the amortization of intangibles (EUR 40 million after tax), share-based
compensation expense (EUR 13 million after tax), shared-based expense
(EUR 23 million after tax), the reversal of results relating to equity-accounted
investees (EUR 23 million after tax) and remaining adjustments of EUR 6
million after tax.
Connected Displays (Monitors)
In September 2005, Philips sold certain activities within its monitors
and at TV business to TPV Technologies, a Hong Kong listed company
for a 15% ownership interest in TPV and a convertible bond of EUR
220 million. A gain of EUR 158 million was recognized in Other
business income. TPV will continue to produce for Philips the monitors
that will be sold under the Philips brand. Philips accounts for the
investment in TPV using the equity-method since Philips can exercise
signicant inuence. Philips also has representation on TPV’s board.
Philips Pension Competence Center
In September 2005, Philips sold the legal entities which perform
the asset management function and the pension administration of
the Philips Pension Fund to Merrill Lynch and Hewitt, respectively.
The transactions resulted in a cash inow of EUR 55 million and
a gain of EUR 43 million, which has been reported under Other
business income.
LG.Philips LCD
In July 2005, LG.Philips LCD issued 65,000,000 American Depository
Shares or an equivalent of 32,500,000 shares, resulting in a dilution
gain of EUR 214 million. Contemporaneously, Philips sold 9,375,000
common shares. In December 2005, Philips sold 18,000,000 common
shares. As a result of these two transactions, Philips had a cash inow
of EUR 938 million and a gain on the sales of shares of EUR 435
million, which has been reported as Results relating to equity-accounted
investees. As a result of these transactions, Philips’ participating share
in LG.Philips LCD was reduced to 32.9%.
TSMC
In July and September 2005, Philips sold 567,605,000 common shares
in the form of American Depository Shares of TSMC. This resulted in
a cash inow of EUR 770 million and a gain of EUR 551 million, which
has been reported as Results relating to equity-accounted investees.
Philips’ shareholding after these transactions was reduced from 19.0%
to 16.4%. In 2005, Philips accounted for this investment using the
equity method of accounting.
Great Nordic
In September 2005, Philips sold its remaining share of 3.1% in Great
Nordic. This resulted in a cash inow of EUR 67 million and a gain
of EUR 13 million, which has been reported under Financial income.
Atos Origin
In July 2005, Philips sold its remaining share of 15.4% in Atos Origin.
This resulted in a cash inow of EUR 554 million and a gain of
EUR 222 million, which has been reported under Financial income.
NAVTEQ
In April and May 2005, Philips sold its remaining share of 37.1%
in NAVTEQ. This resulted in a cash inow of EUR 932 million and
a gain of EUR 768 million, which has been reported as Results relating
to equity-accounted investees.
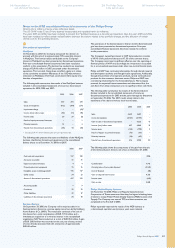
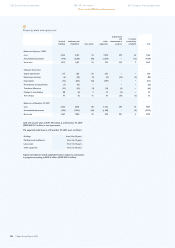
40
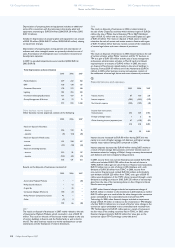
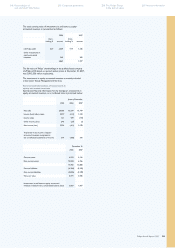
Income from operations
Sales composition
2005 2006 2007
Goods 22,912 24,107 24,270
Services 2,027 2,073 1,973
Licenses 506 502 550
25,445 26,682 26,793
Salaries and wages
2005 2006 2007
Salaries and wages 4,403 4,613 4,607
Pension costs 438 461 434
Other social security and similar charges:
- Required by law 593 636 634
- Voluntary (145) 91 89
5,289 5,801 5,764
See note 56 for further information on pension costs.
For remuneration details of the members of the Board of Management
and the Supervisory Board, see note 34.
For information on share-based compensation, see note 33.
The Company applies IFRS 2 for recognition and measurement of
share-based payments, which are similar to US GAAP-requirements.
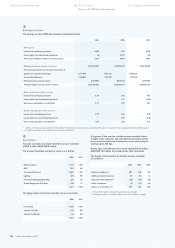
Employees
The average number of employees by category is summarized as
follows (in FTEs):
2005 2006 2007
Production 58,466 59,955 61,447
Research & development 13,659 13,227 12,804
Other 28,338 27,694 28,469
Permanent employees 100,463 100,876 102,720
Temporary employees 15,609 16,225 16,660
Continuing operations 116,072 117,101 119,380
Discontinued operations 44,815 44,040 6,276
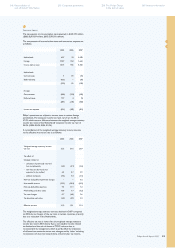
Depreciation and amortization
Depreciation of property, plant and equipment and amortization
of intangibles are as follows:
2005 2006 2007
Depreciation of property, plant
and equipment 557 554 562
Amortization of internal-use software 78 71 76
Amortization of goodwill and other
intangibles:
Amortization of other -
intangible assets
Amortization of development costs -
89
195
152
213
200
245
919 990 1,083
40
Group nancial statements
Notes to the IFRS nancial statements
Company nancial statements 250 Corporate governance246 Reconciliation of
non-US GAAP information 258 The Philips Group
in the last ten years 260
Investor information