Philips 2007 Annual Report Download - page 37
Download and view the complete annual report
Please find page 37 of the 2007 Philips annual report below. You can navigate through the pages in the report by either clicking on the pages listed below, or by using the keyword search tool below to find specific information within the annual report.-
 1
1 -
2
-
3
-
4
-
5
-
6
-
7
-
8
-
9
-
10
-
11
-
12
-
13
-
14
-
15
-
16
-
17
-
18
-
19
-
20
-
21
-
22
-
23
-
24
-
25
-
26
-
 27
27 -
 28
28 -
 29
29 -
 30
30 -
 31
31 -
 32
32 -
 33
33 -
 34
34 -
 35
35 -
 36
36 -
 37
37 -
 38
38 -
 39
39 -
 40
40 -
 41
41 -
 42
42 -
 43
43 -
 44
44 -
 45
45 -
 46
46 -
 47
47 -
48
-
49
-
50
-
51
-
52
-
53
-
54
-
55
-
56
-
57
-
58
-
59
-
60
-
61
-
62
-
63
-
64
-
65
-
66
-
67
-
68
-
69
-
70
-
71
-
72
-
73
-
74
-
75
-
76
-
77
-
78
-
79
-
80
-
81
-
82
-
83
-
84
-
85
-
86
-
87
-
88
-
89
-
90
-
91
-
92
-
93
-
94
-
95
-
96
-
97
-
98
-
99
-
100
-
101
-
102
-
103
-
104
-
105
-
106
-
107
-
108
-
109
-
110
-
111
-
112
-
113
-
114
-
115
-
116
-
117
-
118
-
119
-
120
-
121
-
122
-
123
-
124
-
125
-
126
-
127
-
128
-
129
-
130
-
131
-
132
-
133
-
134
-
135
-
136
-
137
-
138
-
139
-
140
-
141
-
142
-
143
-
144
-
145
-
146
-
147
-
148
-
149
-
150
-
151
-
152
-
153
-
154
-
155
-
156
-
157
-
158
-
159
-
160
-
161
-
162
-
163
-
164
-
165
-
166
-
167
-
168
-
169
-
170
-
171
-
172
-
173
-
174
-
175
-
176
-
177
-
178
-
179
-
180
-
181
-
182
-
183
-
184
-
185
-
186
-
187
-
188
-
189
-
190
-
191
-
192
-
193
-
194
-
195
-
196
-
197
-
198
-
199
-
200
-
201
-
202
-
203
-
204
-
205
-
206
-
207
-
208
-
209
-
210
-
211
-
212
-
213
-
214
-
215
-
216
-
217
-
218
-
219
-
220
-
221
-
222
-
223
-
224
-
225
-
226
-
227
-
228
-
229
-
230
-
231
-
232
-
233
-
234
-
235
-
236
-
237
-
238
-
239
-
240
-
241
-
242
-
243
-
244
-
245
-
246
-
247
-
248
-
249
-
250
-
251
-
252
-
253
-
254
-
255
-
256
-
257
-
258
-
259
-
260
-
261
-
262
 |
 |

Philips Annual Report 2007 43
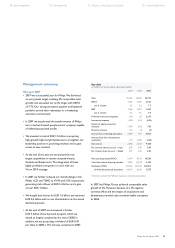
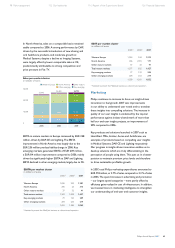
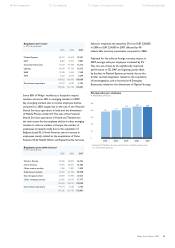
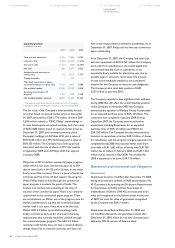
In North America, sales on a comparable basis remained
stable compared to 2006. A strong performance by DAP,
driven by the successful introduction of new shaving and
oral healthcare products, and moderate growth at
Medical Systems, despite a decline at Imaging Systems,
were largely offset by lower comparable sales at CE,
predominantly attributable to strong competition and
price pressure in Flat TV.
Sales per market cluster
in millions of euros
30,000
20,000
10,000
0
4,547
2,834
9,572
7,172
1,320
2005
25,445
4,603
3,251
9,869
7,591
1,368
2006
26,682
2007
4,435
3,605
10,275
7,147
1,331
26,793
Key emerging
Other emerging
Western Europe North America
Other mature
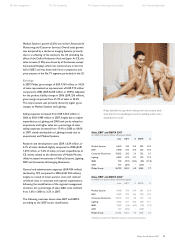
EBITA in mature markets in Europe increased by EUR 328
million, driven by DAP, CE and Lighting. The EBITA
improvement in North America was largely due to the
EUR 256 million product liability charge in 2006. Key
emerging markets generated EBITA of EUR 209 million,
a EUR 84 million improvement compared to 2006, mainly
driven by signicantly higher EBITA at DAP and Lighting.
EBITA declined in other emerging markets, largely due to CE.
EBITA per market cluster
in millions of euros
20051) 20061) 2007
Western Europe 1,036 953 1,281
North America 296 23 315
Other mature markets 37 32 41
Total mature markets 1,369 1,008 1,637
Key emerging markets 79 125 209
Other emerging markets 204 253 219
1,652 1,386 2,065
1) Restated to present the MedQuist business as a discontinued operation
EBIT per market cluster
in millions of euros
20051) 20061) 2007
Western Europe 1,034 944 1,215
North America 206 (151) 171
Other mature markets 37 32 41
Total mature markets 1,277 825 1,427
Key emerging markets 77 123 206
Other emerging markets 204 253 219
1,558 1,201 1,852
1) Restated to present the MedQuist business as a discontinued operation
Marketing
Philips continues to increase its focus on insight-driven
innovation to fuel growth. 2007 saw improvements
in our ability to understand user needs and to translate
these insights into compelling solutions. The increase in
quality of our user insights is evidenced by the top-tier
performance against industry benchmark of more than
half our end-user insight projects, an improvement of
20% compared to 2006.
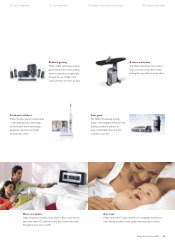
Key products and solutions launched in 2007 such as
HeartStart MRx, Arcitec, Aurea and AmbiScene, are
examples of products based on compelling user insights
in Medical Systems, DAP, CE and Lighting respectively.
Our progress in insight-driven innovation enables us to
develop solutions which are truly differentiating in the
perception of people using them. This puts us in a better
position to maintain premium price levels and therefore
to drive sustainable protable growth.
In 2007, total Philips marketing expenditures amounted to
EUR 994 million, or 3.7% of sales, compared to 3.3 % of sales
in 2006. The spend increases in advertising and promotion
– our largest spend categories – were partly offset by
efciency gains realized in cost of infrastructure. In addition,
we invested more in marketing intelligence to strengthen
our understanding of end-user and customer insights.
98 Risk management 112 Our leadership 116 Report of the Supervisory Board 126 Financial Statements