Philips 2007 Annual Report Download - page 184
Download and view the complete annual report
Please find page 184 of the 2007 Philips annual report below. You can navigate through the pages in the report by either clicking on the pages listed below, or by using the keyword search tool below to find specific information within the annual report.-
 1
1 -
2
-
3
-
4
-
5
-
6
-
7
-
8
-
9
-
10
-
11
-
12
-
13
-
14
-
15
-
16
-
17
-
18
-
19
-
20
-
21
-
22
-
23
-
24
-
25
-
26
-
27
-
28
-
29
-
30
-
31
-
32
-
33
-
34
-
35
-
36
-
37
-
38
-
39
-
40
-
41
-
42
-
43
-
44
-
45
-
46
-
47
-
48
-
49
-
50
-
51
-
52
-
53
-
54
-
55
-
56
-
57
-
58
-
59
-
60
-
61
-
62
-
63
-
64
-
65
-
66
-
67
-
68
-
69
-
70
-
71
-
72
-
73
-
74
-
75
-
76
-
77
-
78
-
79
-
80
-
81
-
82
-
83
-
84
-
85
-
86
-
87
-
88
-
89
-
90
-
91
-
92
-
93
-
94
-
95
-
96
-
97
-
98
-
99
-
100
-
101
-
102
-
103
-
104
-
105
-
106
-
107
-
108
-
109
-
110
-
111
-
112
-
113
-
114
-
115
-
116
-
117
-
118
-
119
-
120
-
121
-
122
-
123
-
124
-
125
-
126
-
127
-
128
-
129
-
130
-
131
-
132
-
133
-
134
-
135
-
136
-
137
-
138
-
139
-
140
-
141
-
142
-
143
-
144
-
145
-
146
-
147
-
148
-
149
-
150
-
151
-
152
-
153
-
154
-
155
-
156
-
157
-
158
-
159
-
160
-
161
-
162
-
163
-
164
-
165
-
166
-
167
-
168
-
169
-
170
-
171
-
172
-
173
-
 174
174 -
 175
175 -
 176
176 -
 177
177 -
 178
178 -
 179
179 -
 180
180 -
 181
181 -
 182
182 -
 183
183 -
 184
184 -
 185
185 -
 186
186 -
 187
187 -
 188
188 -
 189
189 -
 190
190 -
 191
191 -
 192
192 -
 193
193 -
 194
194 -
195
-
196
-
197
-
198
-
199
-
200
-
201
-
202
-
203
-
204
-
205
-
206
-
207
-
208
-
209
-
210
-
211
-
212
-
213
-
214
-
215
-
216
-
217
-
218
-
219
-
220
-
221
-
222
-
223
-
224
-
225
-
226
-
227
-
228
-
229
-
230
-
231
-
232
-
233
-
234
-
235
-
236
-
237
-
238
-
239
-
240
-
241
-
242
-
243
-
244
-
245
-
246
-
247
-
248
-
249
-
250
-
251
-
252
-
253
-
254
-
255
-
256
-
257
-
258
-
259
-
260
-
261
-
262
 |
 |

Philips Annual Report 2007190
General and administrative expenses (EUR 1,124 million) declined
compared to 2006 (EUR 1,174 million), largely as a result of lower
pension costs and reduced overhead costs in corporate and regional
organizations, following the simplication of the regional management
structure. As a percentage of sales, G&A costs declined from 4.4%
in 2006 to 4.2% in 2007.
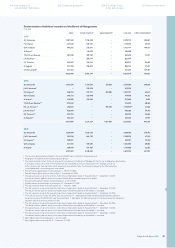
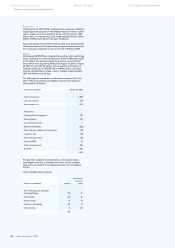
The following overview shows sales, EBIT and EBITA according to
the 2007 sector classication.
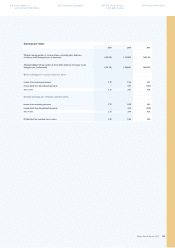
Sales, EBIT and EBITA 2007
in millions of euros unless otherwise stated
sales EBIT % EBITA %
Medical Systems 6,470 742 11.5 862 13.3
DAP 2,968 513 17.3 525 17.7
Consumer Electronics 10,362 312 3.0 315 3.0
Lighting 6,093 618 10.1 665 10.9
I&EB 703 (136) (19.3) (118) (16.8)
GMS 197 (556) − (556) −
Philips Group 26,793 1,493 5.6 1,693 6.3
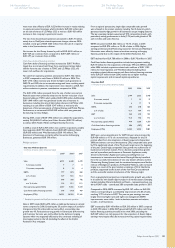
Sales, EBIT and EBITA 2006 1)
in millions of euros unless otherwise stated
sales EBIT % EBITA %
Medical Systems 6,448 780 12.1 874 13.6
DAP 2,532 370 14.6 378 14.9
Consumer Electronics 10,576 299 2.8 300 2.8
Lighting 5,466 516 9.4 547 10.0
I&EB 1,493 (164) (11.0) (146) (9.8)
GMS 167 (844) − (844) −
Philips Group 26,682 957 3.6 1,109 4.2
1) Restated to present the MedQuist business as a discontinued operation
In 2007, EBIT increased by EUR 536 million compared to 2006, to EUR
1,493 million, or 5.6% of sales. Excluding the EUR 182 million product
liability charge which was recognized in 2006, EBIT protability
improved
by 1.3% in relation to sales, driven by the improved performance
of DAP,
Lighting and Group Management & Services.
Total EBITA for the Group increased from EUR 1,109 million, or 4.2%
of sales, in 2006 to EUR 1,693 million, or 6.3% of sales, in 2007. The
main drivers of the year-on-year EBITA improvement were the strong,
mainly sales-driven performance at DAP (EUR 147 million) and higher
earnings at Lighting (EUR 118 million), as a result of higher sales across
almost all businesses and a lower loss in the uorescent-based LCD
backlighting business. Excluding the EUR 182 million negative impact
of product liability charges in 2006, Group Management & Services’
result improved by EUR 106 million due to reduced corporate and
regional costs as well as lower pension and brand campaign costs.
Medical Systems’ EBITA of EUR 862 million, or 13.3% of sales, represents
a slight decline compared to 2006. Higher earnings at Customer Services,
Ultrasound & Monitoring and Healthcare Informatics were offset by lower
earnings at Imaging Systems, largely as a consequence of lower sales.
DAP’s EBITA increase of EUR 147 million compared to 2006 was
primarily driven by strong sales growth, supported by the full-year
contribution of Avent, and by rapid expansion in emerging markets with
stable margins. In addition, effective cost management supported the
EBITA protability increase of 2.8% of sales compared to 2006. All
DAP businesses contributed to the overall year-on-year improvement,
both in nominal terms and as a percentage of sales.
CE’s EBITA reached EUR 315 million, or 3.0% of sales, compared to
2.8% in 2006. A sales decline and high margin pressure at Connected
Displays, particularly in North America, were more than offset by
higher EBITA in the other businesses, most notably Peripherals &
Accessories and Entertainment Solutions.
Lighting’s EBITA improved to EUR 665 million, or 10.9% of sales, mainly
due to higher earnings in Lamps, Lumileds, Luminaires and additional
EBITA from the acquisition of Partners in Lighting International (PLI).
The exit from the loss-making uorescent lamp-based LCD backlighting
business at the beginning of 2007 also added to the EBITA improvement.
The EBITA loss at Innovation & Emerging Businesses amounted to
EUR 118 million, compared to a loss of EUR 146 million in 2006.
EBITA in 2006 included an aggregated gain of EUR 35 million on the
divestment of several businesses within Corporate Investments and
Corporate Technologies. In 2007, EBITA improved due to EUR 45
million higher license income.
EBITA at Group Management & Services improved by EUR 288 million
compared to 2006, when the EUR 182 million asbestos-related product
liability charge was recognized. The improvement in EBITA was also
driven by a reduction in Corporate, Country & Regional overheads
and reduced investments in the brand campaign.
Financial income and expense
Financial income increased from EUR 29 million in 2006 to EUR 2,849
million, primarily due to the EUR 2,783 million gain on the sale of
shares in TSMC. In 2006 there were no sales of securities.
Income taxes
Income taxes amounted to EUR 491 million, compared to EUR 189
million in 2006. The tax burden in 2007 corresponded to an effective
tax rate of 11.3% on pre-tax income, compared to 19.2% in 2006. The
effective tax rate in 2007 was affected by a reduction of the average
statutory tax rate, primarily due to a reduction in the Netherlands as
well as tax-exempt items, most notably the non-taxable gain on the
sale of shares in TSMC. Non-taxable items in 2006 were the TSMC
dividend, as well as the gains and losses resulting from changes in the
fair value of TSMC stock options and the TPV convertible bond. Income
taxes in 2006 were also positively affected by a reduction in the Dutch
corporate tax rate and gains resulting from nal agreements on
prior-year taxes in various jurisdictions.
For further information, please refer to note 42.
Results relating to equity-accounted investees
The results relating to equity-accounted investees increased by EUR
1,023 million compared to 2006 and provided income of EUR 884 million
in 2007. The Company’s participation in the net income of equity-
accounted investees increased from a loss of EUR 188 million in 2006
to a prot of EUR 246 million in 2007, mainly due to higher earnings
at LG.Philips LCD. Earnings from the sale of shares mainly consisted
of the EUR 653 million non-taxable gain on the sale of a 13% stake in
LG.Philips LCD, reducing Philips’ shareholding from 32.9% to 19.9%.
In 2006, a EUR 103 million non-taxable gain was recognized on the
sale of the remaining 8.4 million shares of common stock in FEI, which
reduced Philips’ shareholding from 24.8% to zero.
In 2006, investment impairment and guarantee charges primarily
related to a EUR 61 million loss which was recognized as a result
of agreements made with LG.Philips Displays for voluntary payments
(social contributions and environmental clean-up), mainly in France,
Germany, the Netherlands and the UK.
Minority interests
The share of minority interests in the income of Group companies
reduced income by EUR 7 million, compared to EUR 4 million in 2006.
Discontinued operations
In this Annual Report, Philips reports the results of Mobile Display
Systems, Semiconductors and MedQuist separately as discontinued
operations. Consequently, the related results, including transaction
gains, are shown separately in the nancial statements under
discontinued operations.
The loss from discontinued operations of EUR 73 million in 2007
was primarily attributable to impairment charges for MedQuist.
In 2006, a net gain of EUR 3,683 million was recorded on the sale
of Philips’ majority stake in the Semiconductors division.
Net income
In 2007, income from continuing operations amounted to EUR 4,728
million, an increase of EUR 4,074 million compared with 2006.
The improvement was driven by EUR 536 million higher EBIT and a
EUR 2,820 million increase in nancial income, primarily due to the
sale of shares in TSMC. The EUR 302 million higher income tax charges
128 Group nancial statements 188 IFRS information
IFRS management commentary
240 Company nancial statements