Philips 2007 Annual Report Download - page 185
Download and view the complete annual report
Please find page 185 of the 2007 Philips annual report below. You can navigate through the pages in the report by either clicking on the pages listed below, or by using the keyword search tool below to find specific information within the annual report.-
 1
1 -
2
-
3
-
4
-
5
-
6
-
7
-
8
-
9
-
10
-
11
-
12
-
13
-
14
-
15
-
16
-
17
-
18
-
19
-
20
-
21
-
22
-
23
-
24
-
25
-
26
-
27
-
28
-
29
-
30
-
31
-
32
-
33
-
34
-
35
-
36
-
37
-
38
-
39
-
40
-
41
-
42
-
43
-
44
-
45
-
46
-
47
-
48
-
49
-
50
-
51
-
52
-
53
-
54
-
55
-
56
-
57
-
58
-
59
-
60
-
61
-
62
-
63
-
64
-
65
-
66
-
67
-
68
-
69
-
70
-
71
-
72
-
73
-
74
-
75
-
76
-
77
-
78
-
79
-
80
-
81
-
82
-
83
-
84
-
85
-
86
-
87
-
88
-
89
-
90
-
91
-
92
-
93
-
94
-
95
-
96
-
97
-
98
-
99
-
100
-
101
-
102
-
103
-
104
-
105
-
106
-
107
-
108
-
109
-
110
-
111
-
112
-
113
-
114
-
115
-
116
-
117
-
118
-
119
-
120
-
121
-
122
-
123
-
124
-
125
-
126
-
127
-
128
-
129
-
130
-
131
-
132
-
133
-
134
-
135
-
136
-
137
-
138
-
139
-
140
-
141
-
142
-
143
-
144
-
145
-
146
-
147
-
148
-
149
-
150
-
151
-
152
-
153
-
154
-
155
-
156
-
157
-
158
-
159
-
160
-
161
-
162
-
163
-
164
-
165
-
166
-
167
-
168
-
169
-
170
-
171
-
172
-
173
-
174
-
 175
175 -
 176
176 -
 177
177 -
 178
178 -
 179
179 -
 180
180 -
 181
181 -
 182
182 -
 183
183 -
 184
184 -
 185
185 -
 186
186 -
 187
187 -
 188
188 -
 189
189 -
 190
190 -
 191
191 -
 192
192 -
 193
193 -
 194
194 -
 195
195 -
196
-
197
-
198
-
199
-
200
-
201
-
202
-
203
-
204
-
205
-
206
-
207
-
208
-
209
-
210
-
211
-
212
-
213
-
214
-
215
-
216
-
217
-
218
-
219
-
220
-
221
-
222
-
223
-
224
-
225
-
226
-
227
-
228
-
229
-
230
-
231
-
232
-
233
-
234
-
235
-
236
-
237
-
238
-
239
-
240
-
241
-
242
-
243
-
244
-
245
-
246
-
247
-
248
-
249
-
250
-
251
-
252
-
253
-
254
-
255
-
256
-
257
-
258
-
259
-
260
-
261
-
262
 |
 |

Philips Annual Report 2007 191
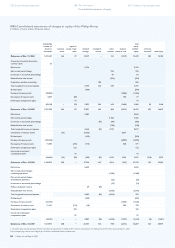
were more than offset by a EUR 1,023 million increase in results relating
to equity-accounted investees, which included a EUR 653 million gain
on the sale of shares of LG.Philips LCD as well as a EUR 433 million
increase in that company’s operational results.
The loss from discontinued operations amounted to EUR 73 million,
mainly due to MedQuist-related impairment charges, whereas 2006
included a total gain of EUR 3,683 million from the sale of a majority
stake in the Semiconductors division.
Net income for the Group showed a prot of EUR 4,655 million, or
EUR 4.29 per common share, compared to EUR 4,664 million, or
EUR 3.97 per common share, in 2006.
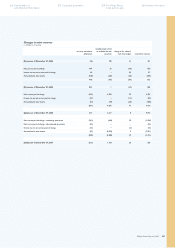
Cash ows before nancing activities
Cash ows before nancing activities increased by EUR 7.9 billion,
largely due to increased cash ows from operating activities, higher
inows from the sale of stakes in TSMC and LG.Philips LCD, and
lower cash outows for acquisitions.
Net cash from operating activities amounted to EUR 1,752 million
in 2007, compared to cash ows of EUR 639 million in 2006. This
EUR 1,113 million increase was driven by higher cash generation at
DAP, CE and GMS, due to increased earnings and lower working capital
requirements. In addition, the improvement was related to a EUR 720
million reduction in pension contributions compared to 2006.
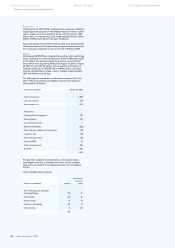
The EUR 4,105 million proceeds from the sale of other non-current
nancial assets were primarily related to the further reduction of our
nancial holding in TSMC, which yielded EUR 3,895 million. Additionally,
EUR 1,640 million cash was generated by the sale of interests in
businesses, including the sale of 46.4 million shares in LG.Philips LCD,
resulting in a cash inow of EUR 1,547 million, as well as by the
divestment of the remaining parts of Optical Storage and Mobile Phones.
Furthermore, a net amount of EUR 385 million cash was generated
by maturing currency hedges.
During 2007, a total of EUR 1,485 million was utilized for acquisitions,
notably PLI (EUR 561 million) and Color Kinetics (EUR 515 million),
as well as DLO, Health Watch and Raytel Cardiac Services.
In 2006, a total of EUR 2,467 million was used for acquisitions, notably
Intermagnetics (EUR 993 million), Avent (EUR 689 million), Lifeline
(EUR 583 million) and Witt Biomedical (EUR 110 million). The
divestment of businesses, primarily within Innovation & Emerging
Businesses, generated EUR 318 million.
Philips sectors
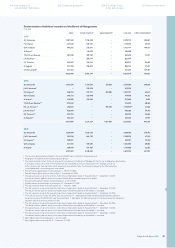
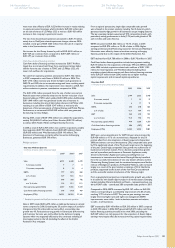
Key data Medical Systems
in millions of euros unless otherwise stated
20051) 20061) 2007
Sales 6,013 6,448 6,470
% increase, nominal 9 7 0
% increase, comparable 8 8 4
EBITA 777 874 862
as % of sales 12.9 13.6 13.3
EBIT 698 780 742
as a % of sales 11.6 12.1 11.5
Net operating capital (NOC) 3,057 4,066 4,064
Cash ows before nancing activities 518 (417) 409
Employees (FTEs) 24,221 26,203 27,441
1) Restated to present the MedQuist business as a discontinued operation
Sales in 2007 totaled EUR 6,470 million, a stable performance in nominal
terms compared to 2006. Excluding the 2% positive impact of portfolio
changes and the 5% unfavorable currency effect, comparable sales
growth was 4%. Particularly strong growth in Ultrasound & Monitoring
and Customer Services was partly offset by the decline in Imaging
Systems which was negatively affected by the continued softening of
the imaging market in the US (including the effect of the Decit
Reduction Act) and Japan.
From a regional perspective, single-digit comparable sales growth
was achieved in the mature markets, including North America, which
generated double-digit growth in all businesses except Imaging Systems.
The key emerging markets experienced 10% comparable growth, with
particularly strong performance in India (17%) and solid growth of 9%
each in China and Latin America.
EBITA amounted to EUR 862 million, or 13.3% of sales, in 2007,
compared to EUR 874 million, or 13.6% of sales, in 2006. Higher
earnings at Ultrasound & Monitoring, Customer Services and Healthcare
Informatics were offset by lower sales-driven earnings at Imaging
Systems, partly due to the impact of the Decit Reduction Act.
EBIT declined from EUR 780 million in 2006 to EUR 742 million in 2007.
Cash ows before nancing activities included net payments totaling
EUR 70 million for the acquisitions of Emergin, VMI and XIMIS in 2007,
while 2006 included acquisition-related cash outows of EUR 1,103
million, for Intermagnetics and Witt Biomedical. Excluding these
acquisition-related disbursements, cash ows before nancing activities
were EUR 207 million below 2006, mainly due to higher working
capital requirements and increased capital expenditures.
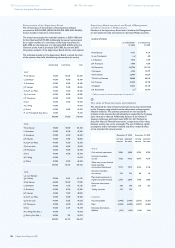
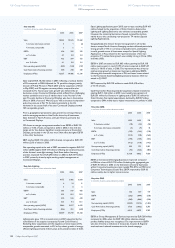
Key data DAP
in millions of euros unless otherwise stated
2005 2006 2007
Sales 2,194 2,532 2,968
% increase, nominal 7 15 17
% increase, comparable 6 11 15
EBITA 345 378 525
as % of sales 15.7 14.9 17.7
EBIT 340 370 513
as a % of sales 15.5 14.6 17.3
Net operating capital (NOC) 474 1,260 1,270
Cash ows before nancing activities 384 (287) 415
Employees (FTEs) 8,203 9,933 9,881
2007 was a very successful year for DAP. Full-year sales increased by
EUR 436 million, or 17%, on a nominal basis. Adjusted for the 5%
positive effect from the integration of Avent (acquired in September
2006) and adverse currency developments (3%), comparable sales grew
by 15%, signicantly ahead of the 7% growth target set at the beginning
of the year. Double-digit comparable sales growth was achieved by all
businesses and market clusters. From a business perspective, growth
was led by excellent performance at Domestic Appliances, mainly
driven by the Kitchen Appliances business, beneting from our
investments in innovation and the brand. Shaving & Beauty beneted
from the successful introduction of two new shavers (Arcitec and the
Moisturizing Shaving System) and the continued acceptance and further
roll-out of Bodygroom products. At Health & Wellness, sales increased
largely as a result of the good market acceptance of Oral Healthcare
products, supported by the launch of the new FlexCare toothbrush
and the successful market introduction of the Wake-up Light.
From a geographical perspective, comparable sales growth was evident
in all countries, with double-digit increases in all market clusters. Emerging
markets including China, India, Brazil and Russia - representing about one
third of DAP’s sales - contributed 28% comparable sales growth in 2007.
Compared to 2006, EBITA increased by EUR 147 million to EUR 525
million, corresponding to a protability improvement of 2.8% of sales,
reaching 17.7% of sales in 2007. The year-on-year earnings rise was
largely driven by higher sales and tight cost management. EBITA
improvements were visible - both in absolute amounts and relative
to sales - in all businesses.
EBIT increased by EUR 143 million to EUR 513 million in 2007, compared
to EUR 370 million in 2006. DAP generated EUR 415 million cash ows
before nancing activities, broadly in line with 2006, excluding the
EUR 689 million net cash payment for the acquisition of Avent. Higher
earnings were largely offset by increased working capital requirements.
Group nancial statements Company nancial statements 250 Corporate governance246 Reconciliation of
non-US GAAP information 258 The Philips Group
in the last ten years 260
Investor information