Philips 2007 Annual Report Download - page 183
Download and view the complete annual report
Please find page 183 of the 2007 Philips annual report below. You can navigate through the pages in the report by either clicking on the pages listed below, or by using the keyword search tool below to find specific information within the annual report.-
 1
1 -
2
-
3
-
4
-
5
-
6
-
7
-
8
-
9
-
10
-
11
-
12
-
13
-
14
-
15
-
16
-
17
-
18
-
19
-
20
-
21
-
22
-
23
-
24
-
25
-
26
-
27
-
28
-
29
-
30
-
31
-
32
-
33
-
34
-
35
-
36
-
37
-
38
-
39
-
40
-
41
-
42
-
43
-
44
-
45
-
46
-
47
-
48
-
49
-
50
-
51
-
52
-
53
-
54
-
55
-
56
-
57
-
58
-
59
-
60
-
61
-
62
-
63
-
64
-
65
-
66
-
67
-
68
-
69
-
70
-
71
-
72
-
73
-
74
-
75
-
76
-
77
-
78
-
79
-
80
-
81
-
82
-
83
-
84
-
85
-
86
-
87
-
88
-
89
-
90
-
91
-
92
-
93
-
94
-
95
-
96
-
97
-
98
-
99
-
100
-
101
-
102
-
103
-
104
-
105
-
106
-
107
-
108
-
109
-
110
-
111
-
112
-
113
-
114
-
115
-
116
-
117
-
118
-
119
-
120
-
121
-
122
-
123
-
124
-
125
-
126
-
127
-
128
-
129
-
130
-
131
-
132
-
133
-
134
-
135
-
136
-
137
-
138
-
139
-
140
-
141
-
142
-
143
-
144
-
145
-
146
-
147
-
148
-
149
-
150
-
151
-
152
-
153
-
154
-
155
-
156
-
157
-
158
-
159
-
160
-
161
-
162
-
163
-
164
-
165
-
166
-
167
-
168
-
169
-
170
-
171
-
172
-
 173
173 -
 174
174 -
 175
175 -
 176
176 -
 177
177 -
 178
178 -
 179
179 -
 180
180 -
 181
181 -
 182
182 -
 183
183 -
 184
184 -
 185
185 -
 186
186 -
 187
187 -
 188
188 -
 189
189 -
 190
190 -
 191
191 -
 192
192 -
 193
193 -
194
-
195
-
196
-
197
-
198
-
199
-
200
-
201
-
202
-
203
-
204
-
205
-
206
-
207
-
208
-
209
-
210
-
211
-
212
-
213
-
214
-
215
-
216
-
217
-
218
-
219
-
220
-
221
-
222
-
223
-
224
-
225
-
226
-
227
-
228
-
229
-
230
-
231
-
232
-
233
-
234
-
235
-
236
-
237
-
238
-
239
-
240
-
241
-
242
-
243
-
244
-
245
-
246
-
247
-
248
-
249
-
250
-
251
-
252
-
253
-
254
-
255
-
256
-
257
-
258
-
259
-
260
-
261
-
262
 |
 |

Philips Annual Report 2007 189
IFRS management commentary
2007 was a successful year for Philips. We realized 5% comparable sales
growth and EBITA of 6.3%. Our strong innovation pipeline and balanced
portfolio proved their robustness in a weakening economic environment.
In 2007 we accelerated the transformation of Philips into a market-
focused, people-centric company capable of delivering sustained prots.
We invested a total of EUR 1.5 billion in acquiring high-growth, high-
margin businesses to strengthen our leadership position in promising
markets and to gain access to new markets.
At the end of the year, we announced the two largest acquisitions in
recent company history, Genlyte and Respironics. The integration of
these highly protable companies is in line with our Vision 2010 strategy.
In 2007 we further reduced our shareholdings in LG.Philips LCD
and TSMC to 19.9% and 5.0% respectively, generating cash inows
of EUR 5.4 billion and a gain of over EUR 3.4 billion.
We bought back shares for EUR 1.6 billion and returned EUR 0.6 billion
cash to our shareholders via the annual dividend payment.
At the end of 2007 we announced a further EUR 5 billion share
buy-back program, which we intend to largely complete by the end of
2008. In addition, we are proposing a dividend of EUR 0.70 per share
in 2008, a 17% increase compared to 2007.
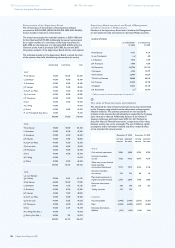
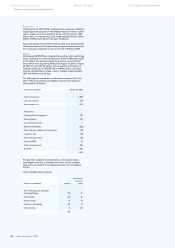
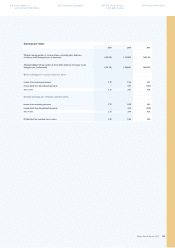
Key data
in millions of euros unless otherwise stated
20051) 20061) 2007
Sales 25,445 26,682 26,793
EBITA 1,595 1,109 1,693
as a % of sales 6.3 4.2 6.3
EBIT 1,506 957 1,493
as a % of sales 5.9 3.6 5.6
Financial income and expenses 108 29 2,849
Income tax expense (501) (189) (491)
Results of equity-accounted investees 2,279 (139) 884
Minority interests (12) (4) (7)
Income from continuing operations 3,380 654 4,728
Discontinued operations (6) 4,010 (73)
Net income 3,374 4,664 4,655
Per common share (in euro) − basic 2.70 3.97 4.29
Per common share (in euro) − diluted 2.70 3.94 4.24
Net operating capital (NOC) 4,227 7,385 8,834
Cash ows before nancing activities 2,854 (2,462) 5,452
Employees (FTEs) 159,226 121,732 123,801
of which discontinued operations 44,174 6,640 5,703
1) Restated to present the MedQuist business as a discontinued operation
Performance of the Group
Sales
Group sales grew by 4.9% on a comparable basis to EUR 26,793 million
in 2007. However, because of a 3.3% negative currency effect and a
1.2% negative net impact of acquisitions and divestments, mainly due
to the divestment of Optical Storage and Mobile Phones, nominal sales
remained stable year-over-year. The comparable sales growth was driven
by all market clusters and all product divisions, and was particularly
strong at DAP (15.4%) and Lighting (6.0%).
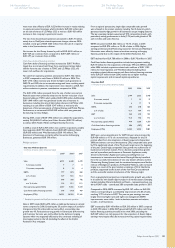
In percentage terms, the composition of sales growth in 2007,
compared to 2006, was as follows:
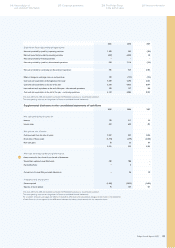
Sales growth composition 2007 versus 2006 1)
in %
com-
parable
growth
currency
effects
consoli-
dation
changes
nominal
growth
Medical Systems 3.6 (5.2) 1.9 0.3
DAP 15.4 (3.1) 4.9 17.2
Consumer Electronics 1.0 (2.2) (0.8) (2.0)
Lighting 6.0 (3.1) 8.6 11.5
I&EB 32.2 (4.5) (80.6) (52.9)
GMS 30.8 (2.3) (10.5) 18.0
Philips Group 4.9 (3.3) (1.2) 0.4
1) Restated to present the MedQuist business as a discontinued operation
The robust sales increase at DAP was driven by double-digit sales
growth in all businesses, most notably Domestic Appliances, and was
visible throughout all market clusters, with especially strong growth
rates in emerging markets. The increase in Lighting sales was mainly
attributable to solid growth in energy-efcient lighting within the
Lamps and Luminaires businesses.
Medical Systems’ comparable growth (3.6%) was led by Ultrasound &
Monitoring and Customer Services. Overall sales growth was tempered
by a decline at Imaging Systems, primarily due to a softening of the
market in the US (including the effect of the Decit Reduction Act)
and Japan. At CE, the sales increase (1.0%) was driven by all businesses,
except Connected Displays, which lost market share in the rst half of
2007, and was faced with erce competition and price pressure in the
Flat TV segment, particularly in the US.
Earnings
In 2007, Philips’ gross margin of EUR 9,115 million, or 34.0% of sales,
represented an improvement of EUR 881 million compared to 2006
(EUR 8,234 million, or 30.9%). Adjusted for the product liability charge
in 2006 (EUR 182 million), gross margin improved from 31.5% of sales
to 34.0%. This improvement was primarily driven by higher gross
margins at Medical Systems and Lighting.
Selling expenses increased from EUR 4,679 million in 2006 to EUR
4,985 million in 2007, largely due to higher expenditures at Lighting
and DAP, both partly related to acquisitions and higher sales. As a
percentage of sales, selling expenses increased from 17.5% in 2006
to 18.6% in 2007, mainly attributable to Lighting (mostly due to
acquisitions) and Medical Systems.
Research and development costs (EUR 1,617 million, or 6.0% of sales)
were broadly in line with 2006 (EUR 1,603 million, or 6.0% of sales).
Group nancial statements Company nancial statements 250 Corporate governance246 Reconciliation of
non-US GAAP information 258 The Philips Group
in the last ten years 260
Investor information