Philips 2007 Annual Report Download - page 30
Download and view the complete annual report
Please find page 30 of the 2007 Philips annual report below. You can navigate through the pages in the report by either clicking on the pages listed below, or by using the keyword search tool below to find specific information within the annual report.-
 1
1 -
2
-
3
-
4
-
5
-
6
-
7
-
8
-
9
-
10
-
11
-
12
-
13
-
14
-
15
-
16
-
17
-
18
-
19
-
 20
20 -
 21
21 -
 22
22 -
 23
23 -
 24
24 -
 25
25 -
 26
26 -
 27
27 -
 28
28 -
 29
29 -
 30
30 -
 31
31 -
 32
32 -
 33
33 -
 34
34 -
 35
35 -
 36
36 -
 37
37 -
 38
38 -
 39
39 -
 40
40 -
41
-
42
-
43
-
44
-
45
-
46
-
47
-
48
-
49
-
50
-
51
-
52
-
53
-
54
-
55
-
56
-
57
-
58
-
59
-
60
-
61
-
62
-
63
-
64
-
65
-
66
-
67
-
68
-
69
-
70
-
71
-
72
-
73
-
74
-
75
-
76
-
77
-
78
-
79
-
80
-
81
-
82
-
83
-
84
-
85
-
86
-
87
-
88
-
89
-
90
-
91
-
92
-
93
-
94
-
95
-
96
-
97
-
98
-
99
-
100
-
101
-
102
-
103
-
104
-
105
-
106
-
107
-
108
-
109
-
110
-
111
-
112
-
113
-
114
-
115
-
116
-
117
-
118
-
119
-
120
-
121
-
122
-
123
-
124
-
125
-
126
-
127
-
128
-
129
-
130
-
131
-
132
-
133
-
134
-
135
-
136
-
137
-
138
-
139
-
140
-
141
-
142
-
143
-
144
-
145
-
146
-
147
-
148
-
149
-
150
-
151
-
152
-
153
-
154
-
155
-
156
-
157
-
158
-
159
-
160
-
161
-
162
-
163
-
164
-
165
-
166
-
167
-
168
-
169
-
170
-
171
-
172
-
173
-
174
-
175
-
176
-
177
-
178
-
179
-
180
-
181
-
182
-
183
-
184
-
185
-
186
-
187
-
188
-
189
-
190
-
191
-
192
-
193
-
194
-
195
-
196
-
197
-
198
-
199
-
200
-
201
-
202
-
203
-
204
-
205
-
206
-
207
-
208
-
209
-
210
-
211
-
212
-
213
-
214
-
215
-
216
-
217
-
218
-
219
-
220
-
221
-
222
-
223
-
224
-
225
-
226
-
227
-
228
-
229
-
230
-
231
-
232
-
233
-
234
-
235
-
236
-
237
-
238
-
239
-
240
-
241
-
242
-
243
-
244
-
245
-
246
-
247
-
248
-
249
-
250
-
251
-
252
-
253
-
254
-
255
-
256
-
257
-
258
-
259
-
260
-
261
-
262
 |
 |

Philips Annual Report 200736
Comparable sales growth was realized by all divisions,
with DAP (15%) and Lighting (6%) delivering particularly
strong growth. Comparable sales growth at CE was limited
to 1%, mainly due to market share losses in Connected
Displays in the rst half of 2007, especially in the US. At
Medical Systems, comparable sales increased by 4%, despite
a softening of the imaging market in the US, due in part
to the impact of the Decit Reduction Act, and in Japan.
Sales growth was particularly strong in emerging markets,
which will continue to be increasingly important to Philips.
Emerging markets, most notably China, Russia and India,
contributed 60% to our comparable sales increase in
value, while accounting for 30% of total revenues.
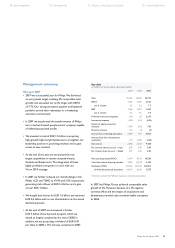
EBIT amounted to EUR 1,852 million, compared to
EUR 1,201 million in 2006.
The Group’s EBITA improved by EUR 679 million and
amounted to EUR 2,065 million, or 7.7% of sales, the
highest margin in recent years, up from 5.2% in 2006.
The higher results were primarily driven by DAP and
Lighting, which achieved EBITA margins of 17.6% and
11.9% respectively. Additionally, the EUR 146 million cost
reduction in the Group Management & Services sector
contributed signicantly to the earnings improvement.
The increase in EBITA was also attributable to a
EUR 256 million product liability charge in 2006.
Income from continuing operations amounted to
EUR 4,601 million, an increase of EUR 3,700 million
compared to 2006. The improvement was driven by
EUR 651 million higher operational earnings and EUR
2,585 million increased nancial income, primarily due
to the sale of shares in TSMC. Income tax charges were
EUR 455 million higher, at an effective tax rate of 13.9%
in 2007 compared to 13.6% in 2006. Results of equity-
accounted investees improved by EUR 920 million,
including a EUR 508 million non-taxable gain from the
sale of shares of LG.Philips LCD and a EUR 456 million
improvement in that company’s operational results.
Income from discontinued operations showed a loss
of EUR 433 million, mainly due to MedQuist-related
impairment charges, taking into account cumulative
foreign currency translation differences. In 2006, income
from discontinued operations included a total gain of
EUR 4,283 million from the sale of Philips’ majority
stake in Semiconductors.
Net income for the Group resulted in a prot of
EUR 4,168 million, or EUR 3.84 per share.
Cash ows before nancing activities increased by
EUR 7.9 billion, largely due to increased cash ows
from operating activities, higher inows from the sale
of stakes in TSMC and LG.Philips LCD, and lower cash
outows for acquisitions.
Performance of the Group
Sales
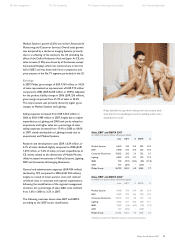
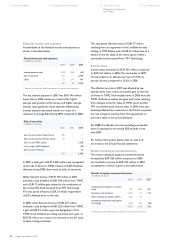
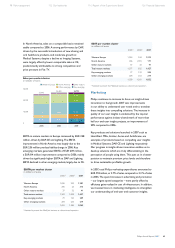
In percentage terms, the composition of sales growth
in 2007, compared to 2006, was as follows:
Sales growth composition 2007 versus 20061)
in %
com-
parable
growth
currency
effects
consoli-
dation
changes
nominal
growth
Medical Systems 3.6 (5.2) 1.9 0.3
DAP 15.4 (3.1) 4.9 17.2
Consumer Electronics 1.0 (2.2) (0.8) (2.0)
Lighting 6.0 (3.1) 8.6 11.5
I&EB 32.2 (4.5) (80.6) (52.9)
GMS 30.8 (2.3) (10.5) 18.0
Philips Group 4.9 (3.3) (1.2) 0.4
1) Restated to present the MedQuist business as a discontinued operation
Group sales grew by 5% on a comparable basis to
EUR 26,793 million in 2007. However, because of a 3%
negative currency effect and a negative net impact of
acquisitions and divestments, mainly due to the divestment
of Optical Storage and Mobile Phones, nominal sales
remained stable year-over-year.
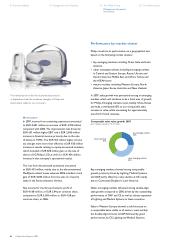
The comparable sales growth was driven by all market
clusters and all product divisions, and was particularly
strong at DAP (15.4%) and Lighting (6.0%).
The robust sales increase at DAP was driven by
double-digit sales growth in all businesses, most notably
Domestic Appliances, and was visible throughout all
market clusters, with especially strong growth rates in
emerging markets. The increase in Lighting sales was
mainly attributable to solid growth in energy-efcient
lighting within the Lamps and Luminaires businesses.
8 Financial highlights 10 Message from the President 16 The Philips Group
Management discussion
and analysis
62 The Philips sectors