Philips 2007 Annual Report Download - page 41
Download and view the complete annual report
Please find page 41 of the 2007 Philips annual report below. You can navigate through the pages in the report by either clicking on the pages listed below, or by using the keyword search tool below to find specific information within the annual report.-
 1
1 -
2
-
3
-
4
-
5
-
6
-
7
-
8
-
9
-
10
-
11
-
12
-
13
-
14
-
15
-
16
-
17
-
18
-
19
-
20
-
21
-
22
-
23
-
24
-
25
-
26
-
27
-
28
-
29
-
30
-
 31
31 -
 32
32 -
 33
33 -
 34
34 -
 35
35 -
 36
36 -
 37
37 -
 38
38 -
 39
39 -
 40
40 -
 41
41 -
 42
42 -
 43
43 -
 44
44 -
 45
45 -
 46
46 -
 47
47 -
 48
48 -
 49
49 -
 50
50 -
 51
51 -
52
-
53
-
54
-
55
-
56
-
57
-
58
-
59
-
60
-
61
-
62
-
63
-
64
-
65
-
66
-
67
-
68
-
69
-
70
-
71
-
72
-
73
-
74
-
75
-
76
-
77
-
78
-
79
-
80
-
81
-
82
-
83
-
84
-
85
-
86
-
87
-
88
-
89
-
90
-
91
-
92
-
93
-
94
-
95
-
96
-
97
-
98
-
99
-
100
-
101
-
102
-
103
-
104
-
105
-
106
-
107
-
108
-
109
-
110
-
111
-
112
-
113
-
114
-
115
-
116
-
117
-
118
-
119
-
120
-
121
-
122
-
123
-
124
-
125
-
126
-
127
-
128
-
129
-
130
-
131
-
132
-
133
-
134
-
135
-
136
-
137
-
138
-
139
-
140
-
141
-
142
-
143
-
144
-
145
-
146
-
147
-
148
-
149
-
150
-
151
-
152
-
153
-
154
-
155
-
156
-
157
-
158
-
159
-
160
-
161
-
162
-
163
-
164
-
165
-
166
-
167
-
168
-
169
-
170
-
171
-
172
-
173
-
174
-
175
-
176
-
177
-
178
-
179
-
180
-
181
-
182
-
183
-
184
-
185
-
186
-
187
-
188
-
189
-
190
-
191
-
192
-
193
-
194
-
195
-
196
-
197
-
198
-
199
-
200
-
201
-
202
-
203
-
204
-
205
-
206
-
207
-
208
-
209
-
210
-
211
-
212
-
213
-
214
-
215
-
216
-
217
-
218
-
219
-
220
-
221
-
222
-
223
-
224
-
225
-
226
-
227
-
228
-
229
-
230
-
231
-
232
-
233
-
234
-
235
-
236
-
237
-
238
-
239
-
240
-
241
-
242
-
243
-
244
-
245
-
246
-
247
-
248
-
249
-
250
-
251
-
252
-
253
-
254
-
255
-
256
-
257
-
258
-
259
-
260
-
261
-
262
 |
 |

Philips Annual Report 2007 47
Employees per sector
in FTEs at year-end
2005 2006 2007
Medical Systems 24,221 26,203 27,441
DAP 8,203 9,933 9,881
Consumer Electronics 15,537 14,486 13,516
Lighting 45,649 47,739 54,323
I&EB 15,130 9,852 7,638
GMS 6,312 6,879 5,299
115,052 115,092 118,098
Discontinued operations 44,174 6,640 5,703
159,226 121,732 123,801
Some 60% of Philips’ workforce is located in mature
markets, and some 40% in emerging markets. In 2007,
key emerging markets saw a nominal employee decline
compared to 2006, largely due to the sale of the Financial
Shared Services operations in India and the divestment
of Mobile Phones within CE. The sale of the Financial
Shared Services operations in
Poland and Thailand was
the main reason for the employee decline in other emerging
markets. In mature markets in Europe, the number of
employees increased, mainly due to the acquisition of
Belgium-based PLI. North America saw an increase in
employees mainly related to the acquisitions of Color
Kinetics, DLO, Health Watch and Raytel Cardiac Services.
Employees per market cluster
in FTEs at year-end
2005 2006 2007
Western Europe 42,226 38,852 46,466
North America 17,455 20,501 21,682
Other mature markets 1,900 1,831 1,850
Total mature markets 61,581 61,184 69,998
Key emerging markets 32,469 31,893 30,323
Other emerging markets 21,002 22,015 17,777
115,052 115,092 118,098
Discontinued operations 44,174 6,640 5,703
159,226 121,732 123,801
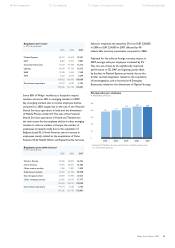
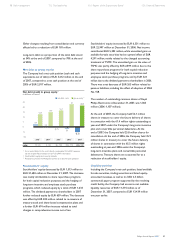
Sales per employee decreased by 2% from EUR 228,000
in 2006 to EUR 224,000 in 2007, affected by 4%
unfavorable currency movements compared to 2006.
Adjusted for the adverse foreign currency impact in
2007, average sales per employee increased by 2%.
This rise was driven by the signicantly improved
performance in CE, DAP and Lighting, partly offset
by declines in Medical Systems, primarily due to the
further vertical integration related to the acquisition
of Intermagnetics, and in Innovation & Emerging
Businesses, related to the divestment of Optical Storage.
Average sales per employee
in thousands of euros
250
200
150
100
50
0
191
20031)
201
20041)
219
20051)
228
20061)
224
2007
1) Excluding the MedQuist business, which has been restated and presented
as a discontinued operation
98 Risk management 112 Our leadership 116 Report of the Supervisory Board 126 Financial Statements