Philips 2007 Annual Report Download - page 256
Download and view the complete annual report
Please find page 256 of the 2007 Philips annual report below. You can navigate through the pages in the report by either clicking on the pages listed below, or by using the keyword search tool below to find specific information within the annual report.-
 1
1 -
2
-
3
-
4
-
5
-
6
-
7
-
8
-
9
-
10
-
11
-
12
-
13
-
14
-
15
-
16
-
17
-
18
-
19
-
20
-
21
-
22
-
23
-
24
-
25
-
26
-
27
-
28
-
29
-
30
-
31
-
32
-
33
-
34
-
35
-
36
-
37
-
38
-
39
-
40
-
41
-
42
-
43
-
44
-
45
-
46
-
47
-
48
-
49
-
50
-
51
-
52
-
53
-
54
-
55
-
56
-
57
-
58
-
59
-
60
-
61
-
62
-
63
-
64
-
65
-
66
-
67
-
68
-
69
-
70
-
71
-
72
-
73
-
74
-
75
-
76
-
77
-
78
-
79
-
80
-
81
-
82
-
83
-
84
-
85
-
86
-
87
-
88
-
89
-
90
-
91
-
92
-
93
-
94
-
95
-
96
-
97
-
98
-
99
-
100
-
101
-
102
-
103
-
104
-
105
-
106
-
107
-
108
-
109
-
110
-
111
-
112
-
113
-
114
-
115
-
116
-
117
-
118
-
119
-
120
-
121
-
122
-
123
-
124
-
125
-
126
-
127
-
128
-
129
-
130
-
131
-
132
-
133
-
134
-
135
-
136
-
137
-
138
-
139
-
140
-
141
-
142
-
143
-
144
-
145
-
146
-
147
-
148
-
149
-
150
-
151
-
152
-
153
-
154
-
155
-
156
-
157
-
158
-
159
-
160
-
161
-
162
-
163
-
164
-
165
-
166
-
167
-
168
-
169
-
170
-
171
-
172
-
173
-
174
-
175
-
176
-
177
-
178
-
179
-
180
-
181
-
182
-
183
-
184
-
185
-
186
-
187
-
188
-
189
-
190
-
191
-
192
-
193
-
194
-
195
-
196
-
197
-
198
-
199
-
200
-
201
-
202
-
203
-
204
-
205
-
206
-
207
-
208
-
209
-
210
-
211
-
212
-
213
-
214
-
215
-
216
-
217
-
218
-
219
-
220
-
221
-
222
-
223
-
224
-
225
-
226
-
227
-
228
-
229
-
230
-
231
-
232
-
233
-
234
-
235
-
236
-
237
-
238
-
239
-
240
-
241
-
242
-
243
-
244
-
245
-
 246
246 -
 247
247 -
 248
248 -
 249
249 -
 250
250 -
 251
251 -
 252
252 -
 253
253 -
 254
254 -
 255
255 -
 256
256 -
 257
257 -
 258
258 -
 259
259 -
 260
260 -
 261
261 -
 262
262
 |
 |

Philips Annual Report 2007262
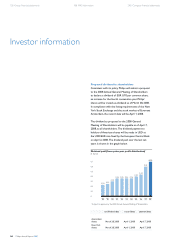
Listings
Philips’ shares are listed on Euronext Amsterdam (PHIA) and the New York
Stock Exchange (PHG), the latter in ADR (American Depositary Receipt) form.
Euronext Amsterdam
20.00
25.00
30.00
35.00
40.00
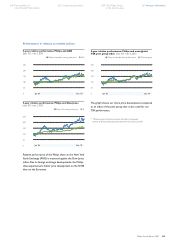
Share price development in Amsterdam, 2007
share price in euros
average
low
high
0
5.0
10.0
Average daily trading volume in millions
7.2
5.8
9.4
7.7
6.3 7.3 7.8
9.4
8.2 8.3 8.7 8.9
Source: Bloomberg
Jan Feb Mar Apr May Jun Jul Aug Sep Oct Nov Dec
Jan Feb Mar Apr May Jun Jul Aug Sep Oct Nov Dec
30.00
35.00
40.00
45.00
50.00
Share price development in New York, 2007
share price in USD
average
low
high
Jan Feb Mar Apr May Jun Jul Aug Sep Oct Nov Dec
0
1.0
2.0
Average daily trading volume in millions
1.1
0.6 0.8 0.7 0.5
0.8 1.0 1.0 0.9 1.1 1.0 1.0
Source: Bloomberg
Jan Feb Mar Apr May Jun Jul Aug Sep Oct Nov Dec
New York Stock Exchange
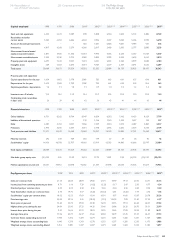
Share price development in Amsterdam, 2007
in euros
Jan Feb Mar Apr May Jun Jul Aug Sep Oct Nov Dec
High 30.06 30.08 29.40 31.22 31.60 31.78 32.99 29.20 31.65 32.15 29.95 30.71
Average 29.10 29.51 28.25 30.06 30.33 31.21 31.68 28.36 30.28 30.08 28.63 29.49
Low 28.01 27.77 26.90 28.50 29.77 30.47 29.41 27.11 28.37 28.29 26.71 28.15
Share price development in New York, 2007
in USD
Jan Feb Mar Apr May Jun Jul Aug Sep Oct Nov Dec
High 39.15 39.38 39.30 42.37 42.42 42.53 45.87 40.43 44.94 45.41 43.84 44.15
Average 37.80 38.59 37.44 40.58 40.97 41.79 43.32 38.65 42.35 42.76 41.98 42.86
Low 36.46 36.72 35.36 38.05 40.00 40.43 39.81 36.69 39.13 40.55 39.49 41.43
128 Group nancial statements 188 IFRS information 240 Company nancial statements