Philips 2007 Annual Report Download - page 173
Download and view the complete annual report
Please find page 173 of the 2007 Philips annual report below. You can navigate through the pages in the report by either clicking on the pages listed below, or by using the keyword search tool below to find specific information within the annual report.-
 1
1 -
2
-
3
-
4
-
5
-
6
-
7
-
8
-
9
-
10
-
11
-
12
-
13
-
14
-
15
-
16
-
17
-
18
-
19
-
20
-
21
-
22
-
23
-
24
-
25
-
26
-
27
-
28
-
29
-
30
-
31
-
32
-
33
-
34
-
35
-
36
-
37
-
38
-
39
-
40
-
41
-
42
-
43
-
44
-
45
-
46
-
47
-
48
-
49
-
50
-
51
-
52
-
53
-
54
-
55
-
56
-
57
-
58
-
59
-
60
-
61
-
62
-
63
-
64
-
65
-
66
-
67
-
68
-
69
-
70
-
71
-
72
-
73
-
74
-
75
-
76
-
77
-
78
-
79
-
80
-
81
-
82
-
83
-
84
-
85
-
86
-
87
-
88
-
89
-
90
-
91
-
92
-
93
-
94
-
95
-
96
-
97
-
98
-
99
-
100
-
101
-
102
-
103
-
104
-
105
-
106
-
107
-
108
-
109
-
110
-
111
-
112
-
113
-
114
-
115
-
116
-
117
-
118
-
119
-
120
-
121
-
122
-
123
-
124
-
125
-
126
-
127
-
128
-
129
-
130
-
131
-
132
-
133
-
134
-
135
-
136
-
137
-
138
-
139
-
140
-
141
-
142
-
143
-
144
-
145
-
146
-
147
-
148
-
149
-
150
-
151
-
152
-
153
-
154
-
155
-
156
-
157
-
158
-
159
-
160
-
161
-
162
-
 163
163 -
 164
164 -
 165
165 -
 166
166 -
 167
167 -
 168
168 -
 169
169 -
 170
170 -
 171
171 -
 172
172 -
 173
173 -
 174
174 -
 175
175 -
 176
176 -
 177
177 -
 178
178 -
 179
179 -
 180
180 -
 181
181 -
 182
182 -
 183
183 -
184
-
185
-
186
-
187
-
188
-
189
-
190
-
191
-
192
-
193
-
194
-
195
-
196
-
197
-
198
-
199
-
200
-
201
-
202
-
203
-
204
-
205
-
206
-
207
-
208
-
209
-
210
-
211
-
212
-
213
-
214
-
215
-
216
-
217
-
218
-
219
-
220
-
221
-
222
-
223
-
224
-
225
-
226
-
227
-
228
-
229
-
230
-
231
-
232
-
233
-
234
-
235
-
236
-
237
-
238
-
239
-
240
-
241
-
242
-
243
-
244
-
245
-
246
-
247
-
248
-
249
-
250
-
251
-
252
-
253
-
254
-
255
-
256
-
257
-
258
-
259
-
260
-
261
-
262
 |
 |

Philips Annual Report 2007 179
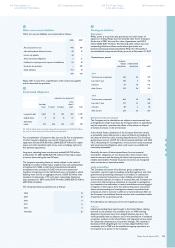
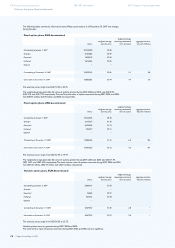
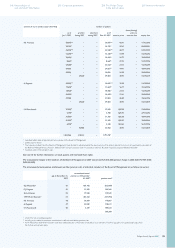
Variable option plans, USD-denominated
shares
weighted average
exercise price
weighted average
remaining contractual
term (in years)
aggregate intrinsic
value (in millions)
Outstanding at January 1, 2007 2,271,642 36.04
Granted − −
Exercised 432,943 31.26
Forfeited 144,438 41.06
Expired − −
Outstanding at December 31, 2007 1,694,261 36.83 2.6 10
Exercisable at December 31, 2007 1,694,261 36.83 2.6 10
The exercise prices range from USD 22.12 to 49.71.
Variable options were not granted during 2007, 2006 and 2005. The total intrinsic value of options exercised during
2007, 2006, and 2005 was USD 4 million, USD 3 million, and USD 1 million, respectively.
The aggregate intrinsic value in the tables above represents the total pretax intrinsic value (the difference between
the Company’s closing stock price on the last trading day of 2007 and the exercise price, multiplied by the number
of in-the-money options) that would have been received by the option holders if the options had been exercised
on December 31, 2007. At December 31, 2007, there was a total of EUR 68 million of unrecognized compensation
cost related to non-vested stock options. This cost is expected to be recognized over a weighted-average period
of 1.9 years. Cash received from option exercises under the Company’s xed and variable option plans amounted
to EUR 140 million, EUR 120 million, and EUR 22 million in 2007, 2006, and 2005, respectively. The actual tax deductions
realized as a result of stock option exercises totaled EUR 36 million, EUR 16 million, and EUR 1 million, in 2007, 2006,
and 2005, respectively.
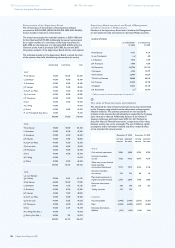
A summary of the status of the Company’s restricted share rights plan as of December 31, 2006 and changes during
the year is presented below:
Restricted share rights, EUR-denominated1)
shares
weighted average
grant-date fair value
Outstanding at January 1, 2007 2,020,930 22.84
Granted 1,384,362 29.84
Vested/Issued 964,094 22.59
Forfeited 83,821 25.07
Outstanding at December 31, 2007 2,357,377 26.97
1) Excludes incremental shares that may be received if shares awarded under the restricted share rights plan are not sold
for a three-year period.
Group nancial statements
Notes to the group nancial statements
Company nancial statements 250 Corporate governance246 Reconciliation of
non-US GAAP information 258 The Philips Group
in the last ten years 260
Investor information