Philips 2007 Annual Report Download - page 103
Download and view the complete annual report
Please find page 103 of the 2007 Philips annual report below. You can navigate through the pages in the report by either clicking on the pages listed below, or by using the keyword search tool below to find specific information within the annual report.-
 1
1 -
2
-
3
-
4
-
5
-
6
-
7
-
8
-
9
-
10
-
11
-
12
-
13
-
14
-
15
-
16
-
17
-
18
-
19
-
20
-
21
-
22
-
23
-
24
-
25
-
26
-
27
-
28
-
29
-
30
-
31
-
32
-
33
-
34
-
35
-
36
-
37
-
38
-
39
-
40
-
41
-
42
-
43
-
44
-
45
-
46
-
47
-
48
-
49
-
50
-
51
-
52
-
53
-
54
-
55
-
56
-
57
-
58
-
59
-
60
-
61
-
62
-
63
-
64
-
65
-
66
-
67
-
68
-
69
-
70
-
71
-
72
-
73
-
74
-
75
-
76
-
77
-
78
-
79
-
80
-
81
-
82
-
83
-
84
-
85
-
86
-
87
-
88
-
89
-
90
-
91
-
92
-
 93
93 -
 94
94 -
 95
95 -
 96
96 -
 97
97 -
 98
98 -
 99
99 -
 100
100 -
 101
101 -
 102
102 -
 103
103 -
 104
104 -
 105
105 -
 106
106 -
 107
107 -
 108
108 -
 109
109 -
 110
110 -
 111
111 -
 112
112 -
 113
113 -
114
-
115
-
116
-
117
-
118
-
119
-
120
-
121
-
122
-
123
-
124
-
125
-
126
-
127
-
128
-
129
-
130
-
131
-
132
-
133
-
134
-
135
-
136
-
137
-
138
-
139
-
140
-
141
-
142
-
143
-
144
-
145
-
146
-
147
-
148
-
149
-
150
-
151
-
152
-
153
-
154
-
155
-
156
-
157
-
158
-
159
-
160
-
161
-
162
-
163
-
164
-
165
-
166
-
167
-
168
-
169
-
170
-
171
-
172
-
173
-
174
-
175
-
176
-
177
-
178
-
179
-
180
-
181
-
182
-
183
-
184
-
185
-
186
-
187
-
188
-
189
-
190
-
191
-
192
-
193
-
194
-
195
-
196
-
197
-
198
-
199
-
200
-
201
-
202
-
203
-
204
-
205
-
206
-
207
-
208
-
209
-
210
-
211
-
212
-
213
-
214
-
215
-
216
-
217
-
218
-
219
-
220
-
221
-
222
-
223
-
224
-
225
-
226
-
227
-
228
-
229
-
230
-
231
-
232
-
233
-
234
-
235
-
236
-
237
-
238
-
239
-
240
-
241
-
242
-
243
-
244
-
245
-
246
-
247
-
248
-
249
-
250
-
251
-
252
-
253
-
254
-
255
-
256
-
257
-
258
-
259
-
260
-
261
-
262
 |
 |

Philips Annual Report 2007 109
Fair value measurement
The company calculates the fair value of derivatives and
sensitivities based on observed liquid market quotations.
Where the instrument is not directly observable, the
valuation techniques used are qualied and benchmarked
regularly with industry.
Pensions
This section further analyzes the pension exposure
and possible risks thereof.
Pension-related exposure to changes in nancial markets
With pension obligations in more than forty countries,
Philips has devoted considerable attention and resources
to ensuring disclosure, awareness and control of the
resulting exposures.
Depending on the investment policies of the respective
pension funds, developments in nancial markets may
have signicant effects on the funded status and the net
periodic pension cost (NPPC) of Philips’ pension plans.
To monitor this exposure to investment risk, Philips uses
a “Global Risk Reward Model”. The model, which covers
approximately 95% of the company’s total pension liabilities
and contains separate modules for the Netherlands, the UK,
the US and Germany, allows stochastic simulations of the
pension accounting gures.
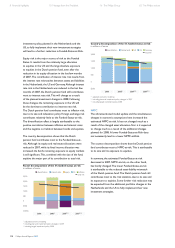
The dispersion of the outcomes of these simulations
around their average (or expected) values provides an
indication of Philips’ risk exposure. The bar charts below
show the maximum deviations from the expected Funded
Status as per year-end 2007 and year-end 2008 and the
expected NPPC for 2008 and 2009, respectively, if the 5%
worst possible outcomes are excluded. These “Funded-
Status-at-risk” and “NPPC-at-risk” measures are based
on the plan assets and liabilities and the bond and equity
market valuations on December 31, 2006 and December
31, 2007 respectively, and may therefore be seen as indicators
of the funding and NPPC risks on these same dates.
The bar charts also show the impact of model updates
and changes in economic assumptions to account for
recent developments in nancial markets and benet
from new modeling techniques. Their impact may be
seen by comparing the rst and the second bars in
each of the charts below. The most important effects
are increased estimates of interest rate risk, lower
estimated
equity risk and increased estimates of ination
risk. These effects are, however, more than offset by an
increased diversication between regions and an
increased
correlation between interest rates and ination.
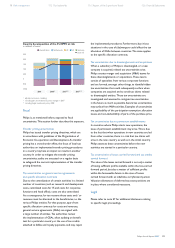
The impact of plan changes, changes in investment policy
and changes in nancial market conditions during 2007
may be seen by comparing the second and the third bars
in the graphs below. The differences between those bars
are largely attributable to changes to the investment
portfolio of the Dutch pension fund, which reduced its
equity and real estate allocations in the last few months
of the year. The proceeds of these changes were used to
increase the xed income allocation and reduce interest
rate risk. The changes to the fund’s investment portfolio
were the rst steps towards implementation of a change
in its investment strategy. The remaining steps towards
implementation are planned to be made in 2008.
The US plan has also changed its investment strategy.
The change entails decreases in equity and interest
rate risk. Some rst steps towards implementation
of this new strategy were made in 2007 and additional
steps are planned to be made in 2008. The impact of the
additional steps by the Dutch and the US pension funds
towards full implementation of their revised strategies
may be seen by comparing the third and the fourth bars
in the graphs below.
The composition of the respective bars shows how
funding risk may be attributed to economic factors
(interest rate risk, equity risk, ination risk and foreign
exchange risk) and country factors (risk exposures in
the Netherlands, the US, the UK and Germany). Because
of the less than 100% (or even negative) correlation
between the different economic and/or country factors,
the total risk may well be lower than the sum of the
underlying factors. This is called the diversication effect,
which is also shown in the graphs.
Funded status
The model update and the changes in economic
assumptions referred to above have caused an increase
in the estimated total contribution of the respective
risk factors to the overall Funded-Status-at-Risk.
However, as this is more than offset by an increased
diversication effect, the net impact has been a decrease
in the estimated Funded-Status-at-Risk. The Funded
Status-at-Risk has also decreased as a result of the
aforementioned changes in the investment portfolio
of the Dutch pension fund. The additional changes in
98 Risk management 112 Our leadership 116 Report of the Supervisory Board 126 Financial Statements