Philips 2007 Annual Report Download - page 146
Download and view the complete annual report
Please find page 146 of the 2007 Philips annual report below. You can navigate through the pages in the report by either clicking on the pages listed below, or by using the keyword search tool below to find specific information within the annual report.-
 1
1 -
2
-
3
-
4
-
5
-
6
-
7
-
8
-
9
-
10
-
11
-
12
-
13
-
14
-
15
-
16
-
17
-
18
-
19
-
20
-
21
-
22
-
23
-
24
-
25
-
26
-
27
-
28
-
29
-
30
-
31
-
32
-
33
-
34
-
35
-
36
-
37
-
38
-
39
-
40
-
41
-
42
-
43
-
44
-
45
-
46
-
47
-
48
-
49
-
50
-
51
-
52
-
53
-
54
-
55
-
56
-
57
-
58
-
59
-
60
-
61
-
62
-
63
-
64
-
65
-
66
-
67
-
68
-
69
-
70
-
71
-
72
-
73
-
74
-
75
-
76
-
77
-
78
-
79
-
80
-
81
-
82
-
83
-
84
-
85
-
86
-
87
-
88
-
89
-
90
-
91
-
92
-
93
-
94
-
95
-
96
-
97
-
98
-
99
-
100
-
101
-
102
-
103
-
104
-
105
-
106
-
107
-
108
-
109
-
110
-
111
-
112
-
113
-
114
-
115
-
116
-
117
-
118
-
119
-
120
-
121
-
122
-
123
-
124
-
125
-
126
-
127
-
128
-
129
-
130
-
131
-
132
-
133
-
134
-
135
-
 136
136 -
 137
137 -
 138
138 -
 139
139 -
 140
140 -
 141
141 -
 142
142 -
 143
143 -
 144
144 -
 145
145 -
 146
146 -
 147
147 -
 148
148 -
 149
149 -
 150
150 -
 151
151 -
 152
152 -
 153
153 -
 154
154 -
 155
155 -
 156
156 -
157
-
158
-
159
-
160
-
161
-
162
-
163
-
164
-
165
-
166
-
167
-
168
-
169
-
170
-
171
-
172
-
173
-
174
-
175
-
176
-
177
-
178
-
179
-
180
-
181
-
182
-
183
-
184
-
185
-
186
-
187
-
188
-
189
-
190
-
191
-
192
-
193
-
194
-
195
-
196
-
197
-
198
-
199
-
200
-
201
-
202
-
203
-
204
-
205
-
206
-
207
-
208
-
209
-
210
-
211
-
212
-
213
-
214
-
215
-
216
-
217
-
218
-
219
-
220
-
221
-
222
-
223
-
224
-
225
-
226
-
227
-
228
-
229
-
230
-
231
-
232
-
233
-
234
-
235
-
236
-
237
-
238
-
239
-
240
-
241
-
242
-
243
-
244
-
245
-
246
-
247
-
248
-
249
-
250
-
251
-
252
-
253
-
254
-
255
-
256
-
257
-
258
-
259
-
260
-
261
-
262
 |
 |

Philips Annual Report 2007152
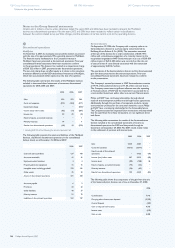
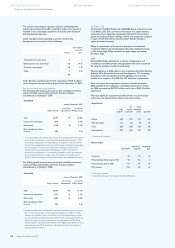
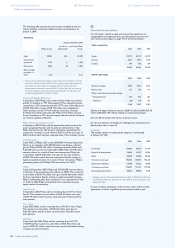
The following table presents the year-to-date unaudited pro-forma
results of Philips, assuming Lumileds had been consolidated as of
January 1, 2004:
Unaudited
January-December 2004
Philips Group
pro forma
adjustments1)
pro forma Philips
Group
Sales 24,855 234 25,089
Income from
operations 1,156 4 1,160
Net income 2,836 (7) 2,829
Basic earnings
per share - in
euros 2.22 2.21
1) The pro forma adjustments relate to sales, Income from operations and net
results of Lumileds of 2004 (EUR 52 million positive impact after taxes) and
also reect the amortization of intangibles (EUR 19 million after tax),
share-based compensation expense (EUR 13 million after tax), the reversal
of results relating to equity-accounted investees (EUR 23 million after tax)
and remaining adjustments of EUR 4 million.
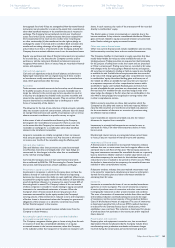
Connected Displays (Monitors)
In September 2005, Philips sold certain activities within its monitors
and at TV business to TPV Technologies (TPV), a Hong Kong listed
company, for a 15% ownership interest in TPV and a convertible bond
of EUR 220 million. A gain of EUR 136 million was recognized in
Other business income. TPV will continue to produce monitors
for Philips that will be sold under the Philips brand. Philips accounts
for the investment in TPV using the equity method since the Company
can exercise signicant inuence.
Philips Pension Competence Center
In September 2005, Philips sold the legal entities which perform the
asset management function and the pension administration of the
Philips Pension Fund to Merrill Lynch and Hewitt, respectively. The
transactions resulted in a cash inow of EUR 55 million and a gain of
EUR 42 million, which has been reported under Other business income.
LG.Philips LCD
In July 2005, LG.Philips LCD issued 65,000,000 American Depository
Shares or an equivalent of 32,500,000 shares, resulting in a dilution
gain for Philips of EUR 189 million. Contemporaneously, Philips sold
9,375,000 common shares. In December 2005, Philips sold 18 million
common shares. As a result of these two transactions, Philips had
a cash inow of EUR 938 million and a gain on the sales of shares
of EUR 332 million, which has been reported as Results relating to
equity-accounted investees. As a result of these transactions, Philips’s
participating share in LG.Philips LCD was reduced to 32.9%.
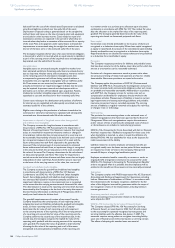
TSMC
In July and September 2005, Philips sold 567,605,000 common shares
in the form of American Depository Shares of TSMC. This resulted in
a cash inow of EUR 770 million and a gain of EUR 460 million, which
has been reported as Results relating to equity-accounted investees.
Philips’ shareholding after these transactions was reduced from 19.0%
to 16.4%. In 2005, Philips accounted for this investment using the
equity method of accounting.
Great Nordic
In September 2005, Philips sold its remaining share of 3.1% in Great
Nordic. This resulted in a cash inow of EUR 67 million and a gain
of EUR 48 million, which has been reported under Financial income
and expenses.
Atos Origin
In July 2005, Philips sold its remaining share of 15.4% in Atos Origin.
This resulted in a cash inow of EUR 554 million and a gain of
EUR 185 million, which has been reported under Financial income
and expenses.
NAVTEQ
In April and May 2005, Philips sold its remaining share of 37.1%
in NAVTEQ. This resulted in a cash inow of EUR 932 million and
a gain of EUR 753 million, which has been reported as Results relating
to equity-accounted investees.
3
Income from operations
For information related to sales and income from operations on
a geographical and segmental basis, see Information by sectors and
main countries that begins on page 137 of this Annual Report.
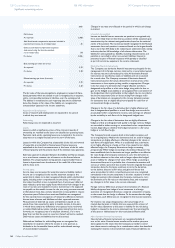
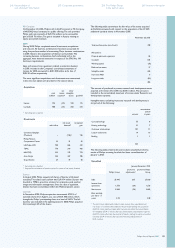
Sales composition
2005 2006 2007
Goods 22,912 24,107 24,270
Services 2,027 2,073 1,973
Licenses 506 502 550
25,445 26,682 26,793
Salaries and wages
2005 2006 2007
Salaries and wages 4,403 4,613 4,607
Pension costs 216 155 111
Other social security and similar charges:
− Required by law 593 635 634
− Voluntary (24) 104 101
5,188 5,507 5,453
Salaries and wages include an amount of EUR 35 million (2006: EUR 78
million, 2005: EUR 106 million) relating to restructuring charges.
See note 20 for further information on pension costs.
For the remuneration of the Board of Management and Supervisory
Board, please refer to note 34.
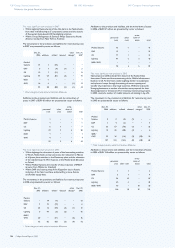
Employees
The average number of employees by category is summarized
as follows (in FTEs):
2005 2006 2007
Production 58,466 59,955 61,447
Research & development 13,659 13,227 12,804
Other 28,338 27,694 28,469
Permanent employees 100,463 100,876 102,720
Temporary employees 15,609 16,225 16,660
Continuing operations 116,072 117,101 119,380
Discontinued operations1) 44,815 44,040 6,276
1) Average number of discontinued operations relates to MDS, Semiconductors
and MedQuist. MDS was reported until June 2006 and Semiconductors until
September 2006.
In many countries, employees render services under collective labor
agreements, of which a signicant portion expires within a year.
128 Group nancial statements
Notes to the group nancial statements
188 IFRS information 240 Company nancial statements