Philips 2007 Annual Report Download - page 159
Download and view the complete annual report
Please find page 159 of the 2007 Philips annual report below. You can navigate through the pages in the report by either clicking on the pages listed below, or by using the keyword search tool below to find specific information within the annual report.-
 1
1 -
2
-
3
-
4
-
5
-
6
-
7
-
8
-
9
-
10
-
11
-
12
-
13
-
14
-
15
-
16
-
17
-
18
-
19
-
20
-
21
-
22
-
23
-
24
-
25
-
26
-
27
-
28
-
29
-
30
-
31
-
32
-
33
-
34
-
35
-
36
-
37
-
38
-
39
-
40
-
41
-
42
-
43
-
44
-
45
-
46
-
47
-
48
-
49
-
50
-
51
-
52
-
53
-
54
-
55
-
56
-
57
-
58
-
59
-
60
-
61
-
62
-
63
-
64
-
65
-
66
-
67
-
68
-
69
-
70
-
71
-
72
-
73
-
74
-
75
-
76
-
77
-
78
-
79
-
80
-
81
-
82
-
83
-
84
-
85
-
86
-
87
-
88
-
89
-
90
-
91
-
92
-
93
-
94
-
95
-
96
-
97
-
98
-
99
-
100
-
101
-
102
-
103
-
104
-
105
-
106
-
107
-
108
-
109
-
110
-
111
-
112
-
113
-
114
-
115
-
116
-
117
-
118
-
119
-
120
-
121
-
122
-
123
-
124
-
125
-
126
-
127
-
128
-
129
-
130
-
131
-
132
-
133
-
134
-
135
-
136
-
137
-
138
-
139
-
140
-
141
-
142
-
143
-
144
-
145
-
146
-
147
-
148
-
 149
149 -
 150
150 -
 151
151 -
 152
152 -
 153
153 -
 154
154 -
 155
155 -
 156
156 -
 157
157 -
 158
158 -
 159
159 -
 160
160 -
 161
161 -
 162
162 -
 163
163 -
 164
164 -
 165
165 -
 166
166 -
 167
167 -
 168
168 -
 169
169 -
170
-
171
-
172
-
173
-
174
-
175
-
176
-
177
-
178
-
179
-
180
-
181
-
182
-
183
-
184
-
185
-
186
-
187
-
188
-
189
-
190
-
191
-
192
-
193
-
194
-
195
-
196
-
197
-
198
-
199
-
200
-
201
-
202
-
203
-
204
-
205
-
206
-
207
-
208
-
209
-
210
-
211
-
212
-
213
-
214
-
215
-
216
-
217
-
218
-
219
-
220
-
221
-
222
-
223
-
224
-
225
-
226
-
227
-
228
-
229
-
230
-
231
-
232
-
233
-
234
-
235
-
236
-
237
-
238
-
239
-
240
-
241
-
242
-
243
-
244
-
245
-
246
-
247
-
248
-
249
-
250
-
251
-
252
-
253
-
254
-
255
-
256
-
257
-
258
-
259
-
260
-
261
-
262
 |
 |

Philips Annual Report 2007 165
North America are covered by dened-benet pension plans. The
benets provided by these plans are based on employees’ years of
dened-benet pension plans is December 31.
to provide assets sufcient to meet the benets payable to dened-
benet pension plan participants. These contributions are determined
based upon various factors, including funded status, legal and tax
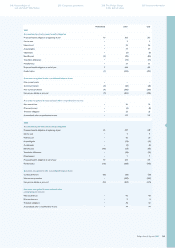
Dened - benet plans
Dened - contribution plans incl.
20
2006 2007
Netherlands other total Netherlands other total
Amounts recognized in the consolidated balance sheet
Prepaid pension costs under other non-current assets 2,143 119 2,262 2,526 177 2,703
Accrued pension costs under other non-current liabilities − (442) (442) − (369) (369)
Provisions for pensions under provisions including
discontinued operations (18) (860) (878) (15) (798) (813)
Net pension asset/(liability) at year - end 2,125 (1,183) 942 2,511 (990) 1,521
Amounts recognized in accumulated other
comprehensive income (before tax)
Net actuarial loss 273 1,301 1,574 105 1,083 1,188
Prior-service cost (credit) (464) 52 (412) (421) 36 (385)
Accumulated other comprehensive income (191) 1,353 1,162 (316) 1,119 803
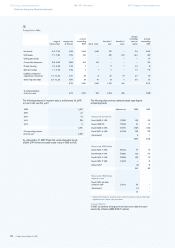
The weighted average assumptions used to calculate the projected benet obligations as of December 31
were as follows:
2006 2007
Netherlands other Netherlands other
Discount rate 4.3% 5.2% 4.8% 5.6%
Rate of compensation increase * 3.5% * 3.9%
The weighted-average assumptions used to calculate the net periodic pension cost for the years ended
December 31 were as follows:
2006 2007
Netherlands other Netherlands other
Discount rate 4.2% 5.1% 4.3% 5.2%
Expected returns on plans assets 5.7% 6.1% 5.7% 6.1%
Rate of compensation increase * 3.4% * 3.5%
* The rate of compensation increase for the Netherlands consists of a general compensation increase and an individual salary increase
based on merit, seniority and promotion. The average individual salary increase for all active participants for the remaining working
lifetime is estimated at 0.75% annually. The assumed rate of general compensation increase for the Netherlands for calculating the
projected benet obligations amounts to 2.3% (2006: 2.0%). The indexation assumption used to calculate the projected benet
obligations for the Netherlands is 2.3% (2006: 2.0%) until 2008 and 1.15% (2006: 1.0%) from 2008 onwards.The difference reects a
change in indexation policy.
Group nancial statements
Notes to the group nancial statements
Company nancial statements 250 Corporate governance246 Reconciliation of
non-US GAAP information 258 The Philips Group
in the last ten years 260
Investor information