Philips 2007 Annual Report Download - page 253
Download and view the complete annual report
Please find page 253 of the 2007 Philips annual report below. You can navigate through the pages in the report by either clicking on the pages listed below, or by using the keyword search tool below to find specific information within the annual report.-
 1
1 -
2
-
3
-
4
-
5
-
6
-
7
-
8
-
9
-
10
-
11
-
12
-
13
-
14
-
15
-
16
-
17
-
18
-
19
-
20
-
21
-
22
-
23
-
24
-
25
-
26
-
27
-
28
-
29
-
30
-
31
-
32
-
33
-
34
-
35
-
36
-
37
-
38
-
39
-
40
-
41
-
42
-
43
-
44
-
45
-
46
-
47
-
48
-
49
-
50
-
51
-
52
-
53
-
54
-
55
-
56
-
57
-
58
-
59
-
60
-
61
-
62
-
63
-
64
-
65
-
66
-
67
-
68
-
69
-
70
-
71
-
72
-
73
-
74
-
75
-
76
-
77
-
78
-
79
-
80
-
81
-
82
-
83
-
84
-
85
-
86
-
87
-
88
-
89
-
90
-
91
-
92
-
93
-
94
-
95
-
96
-
97
-
98
-
99
-
100
-
101
-
102
-
103
-
104
-
105
-
106
-
107
-
108
-
109
-
110
-
111
-
112
-
113
-
114
-
115
-
116
-
117
-
118
-
119
-
120
-
121
-
122
-
123
-
124
-
125
-
126
-
127
-
128
-
129
-
130
-
131
-
132
-
133
-
134
-
135
-
136
-
137
-
138
-
139
-
140
-
141
-
142
-
143
-
144
-
145
-
146
-
147
-
148
-
149
-
150
-
151
-
152
-
153
-
154
-
155
-
156
-
157
-
158
-
159
-
160
-
161
-
162
-
163
-
164
-
165
-
166
-
167
-
168
-
169
-
170
-
171
-
172
-
173
-
174
-
175
-
176
-
177
-
178
-
179
-
180
-
181
-
182
-
183
-
184
-
185
-
186
-
187
-
188
-
189
-
190
-
191
-
192
-
193
-
194
-
195
-
196
-
197
-
198
-
199
-
200
-
201
-
202
-
203
-
204
-
205
-
206
-
207
-
208
-
209
-
210
-
211
-
212
-
213
-
214
-
215
-
216
-
217
-
218
-
219
-
220
-
221
-
222
-
223
-
224
-
225
-
226
-
227
-
228
-
229
-
230
-
231
-
232
-
233
-
234
-
235
-
236
-
237
-
238
-
239
-
240
-
241
-
242
-
 243
243 -
 244
244 -
 245
245 -
 246
246 -
 247
247 -
 248
248 -
 249
249 -
 250
250 -
 251
251 -
 252
252 -
 253
253 -
 254
254 -
 255
255 -
 256
256 -
 257
257 -
 258
258 -
 259
259 -
 260
260 -
 261
261 -
 262
262
 |
 |

Philips Annual Report 2007 259
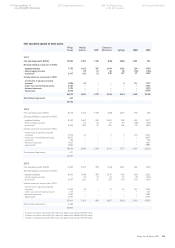
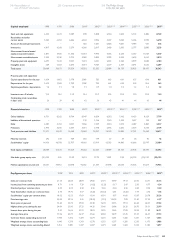
Capital employed 1998 1999 2000 2001
2)
2002
2) 3)
2003
2) 3) 4)
2004
2) 3) 4)
2005
2) 3) 4)
2006
2) 3) 4)
2007
4)
Cash and cash equivalents 6,553 2,331 1,089 890 1,858 2,946 4,205 5,143 5,886 8,769
Receivables and other
current assets 5,442 6,453 6,806 6,540 4,906 4,437 5,028 5,436 5,990 5,690
Assets of discontinued operations − − − 426 7,381 6,838 4,661 4,484 431 333
Inventories 4,017 4,268 5,279 4,240 2,817 2,468 2,500 2,797 2,880 3,203
Non-current nancial assets/
equity-accounted investees 2,871 7,400 11,306 11,033 4,995 4,096 6,235 6,067 11,029 5,069
Non-current receivables/assets 1,920 2,326 2,713 3,080 2,823 2,782 3,035 3,438 3,661 3,810
Property, plant and equipment 6,597 7,332 9,041 7,474 3,001 2,843 2,768 2,999 3,084 3,180
Intangible assets 609 1,563 3,290 5,519 4,424 2,579 2,307 3,541 5,536 6,289
Total assets 28,009 31,673 39,524 39,202 32,205 28,989 30,739 33,905 38,497 36,343
Property, plant and equipment:
Capital expenditures for the year 1,634 1,662 3,170 2,069 720 663 661 637 696 661
Depreciation for the year 1,615 1,548 1,789 1,908 795 641 635 542 554 562
Capital expenditures : depreciation
1.0 1.1 1.8 1.1 0.9 1.0 1.0 1.2 1.3 1.2
Inventories as a % of sales 13.2 13.6 13.9 13.4 10.7 10.5 10.2 11.0 10.8 12.0
Outstanding trade receivables,
in days’ sales 36 39 42 42 36 43 41 44 45 44
Financial structure 1998
1999 2000 2001
2)
2002
2) 3)
2003
2) 3) 4)
2004
2) 3) 4)
2005
2) 3) 4)
2006
2) 3) 4)
2007
4)
Other liabilities 6,751 8,262 8,764 8,047 6,854 6,292 7,142 8,433 8,129 7,799
Liabilities of discontinued operations
− − − 196 1,166 1,345 1,529 1,627 169 157
Debt 3,587 3,314 4,027 7,866 7,109 5,876 4,513 4,487 3,869 3,557
Provisions 2,973 3,056 3,557 3,731 2,978 2,646 2,636 2,634 3,293 3,104
Total provisions and liabilities 13,311 14,632 16,348 19,840 18,107 16,159 15,820 17,181 15,460 14,617
Minority interests 242 333 469 202 179 67 59 58 40 42
Stockholders’ equity 14,456 16,708 22,707 19,160 13,919 12,763 14,860 16,666 22,997 21,684
Total equity and liabilities 28,009 31,673 39,524 39,202 32,205 28,989 30,739 33,905 38,497 36,343
Net debt : group equity ratio (25):125 5:95 11:89 26:74 27:73 19:81 2:98 (4):104 (10):110 (32):132
Market capitalization at year-end 20,631 44,942 50,098 42,532 21,309 29,648 25,003 31,536 31,624 31,436
Key gures per share 1998
1)
1999 2000 2001
2)
2002
2) 3)
2003
2) 3) 4)
2004
2) 3) 4)
2005
2) 3) 4)
2006
2) 3) 4)
2007
4)
Sales per common share 21.15 22.83 28.84 24.82 21.01 18.49 19.13 20.36 22.71 25.16
Income (loss) from continuing operations per share
0.71 1.16 7.29 (1.82) (2.25) 0.17 2.47 2.30 0.77 4.24
Dividend paid per common share 0.23 0.25 0.30 0.36 0.36 0.36 0.36 0.40 0.44 0.60
Total shareholder return per common share 0.73 19.70 5.57 (5.28) (16.32) 6.81 (3.28) 7.14 2.76 1.55
Stockholders’ equity per common share 10.02 12.55 17.69 15.04 10.91 9.97 11.60 13.87 20.78 20.36
Price/earnings ratio 20.09 29.16 5.35 (18.30) (7.74) 134.99 7.89 11.40 37.22 6.97
Share price at year-end 14.30 33.75 39.02 33.38 16.70 23.15 19.51 26.25 28.57 29.52
Highest share price during the year 24.04 33.90 57.25 44.20 35.40 24.86 26.20 26.70 29.31 32.99
Lowest share price during the year 9.37 14.66 31.21 18.03 13.25 12.65 17.89 18.53 21.89 26.71
Average share price 17.06 22.77 46.37 31.66 25.58 18.79 21.45 21.59 26.57 29.73
Common shares outstanding at year-end 1,443 1,332 1,284 1,274 1,276 1,281 1,282 1,201 1,107 1,065
Weighted average shares outstanding-basic 1,440 1,378 1,313 1,278 1,275 1,277 1,280 1,250 1,175 1,086
Weighted average shares outstanding-diluted 1,452 1,389 1,327 1,287 1,279 1,281 1,284 1,253 1,183 1,097
Group nancial statements Company nancial statements 250 Corporate governance246 Reconciliation of
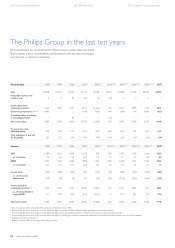
non-US GAAP information 258 The Philips Group
in the last ten years
260
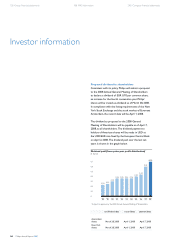
Investor information