Philips 2007 Annual Report Download - page 62
Download and view the complete annual report
Please find page 62 of the 2007 Philips annual report below. You can navigate through the pages in the report by either clicking on the pages listed below, or by using the keyword search tool below to find specific information within the annual report.-
 1
1 -
2
-
3
-
4
-
5
-
6
-
7
-
8
-
9
-
10
-
11
-
12
-
13
-
14
-
15
-
16
-
17
-
18
-
19
-
20
-
21
-
22
-
23
-
24
-
25
-
26
-
27
-
28
-
29
-
30
-
31
-
32
-
33
-
34
-
35
-
36
-
37
-
38
-
39
-
40
-
41
-
42
-
43
-
44
-
45
-
46
-
47
-
48
-
49
-
50
-
51
-
 52
52 -
 53
53 -
 54
54 -
 55
55 -
 56
56 -
 57
57 -
 58
58 -
 59
59 -
 60
60 -
 61
61 -
 62
62 -
 63
63 -
 64
64 -
 65
65 -
 66
66 -
 67
67 -
 68
68 -
 69
69 -
 70
70 -
 71
71 -
 72
72 -
73
-
74
-
75
-
76
-
77
-
78
-
79
-
80
-
81
-
82
-
83
-
84
-
85
-
86
-
87
-
88
-
89
-
90
-
91
-
92
-
93
-
94
-
95
-
96
-
97
-
98
-
99
-
100
-
101
-
102
-
103
-
104
-
105
-
106
-
107
-
108
-
109
-
110
-
111
-
112
-
113
-
114
-
115
-
116
-
117
-
118
-
119
-
120
-
121
-
122
-
123
-
124
-
125
-
126
-
127
-
128
-
129
-
130
-
131
-
132
-
133
-
134
-
135
-
136
-
137
-
138
-
139
-
140
-
141
-
142
-
143
-
144
-
145
-
146
-
147
-
148
-
149
-
150
-
151
-
152
-
153
-
154
-
155
-
156
-
157
-
158
-
159
-
160
-
161
-
162
-
163
-
164
-
165
-
166
-
167
-
168
-
169
-
170
-
171
-
172
-
173
-
174
-
175
-
176
-
177
-
178
-
179
-
180
-
181
-
182
-
183
-
184
-
185
-
186
-
187
-
188
-
189
-
190
-
191
-
192
-
193
-
194
-
195
-
196
-
197
-
198
-
199
-
200
-
201
-
202
-
203
-
204
-
205
-
206
-
207
-
208
-
209
-
210
-
211
-
212
-
213
-
214
-
215
-
216
-
217
-
218
-
219
-
220
-
221
-
222
-
223
-
224
-
225
-
226
-
227
-
228
-
229
-
230
-
231
-
232
-
233
-
234
-
235
-
236
-
237
-
238
-
239
-
240
-
241
-
242
-
243
-
244
-
245
-
246
-
247
-
248
-
249
-
250
-
251
-
252
-
253
-
254
-
255
-
256
-
257
-
258
-
259
-
260
-
261
-
262
 |
 |

Philips Annual Report 200768
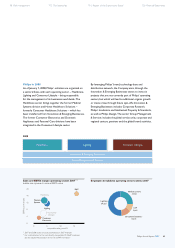
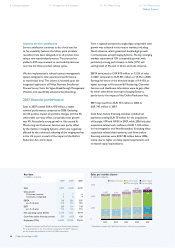
Key data
in millions of euros
20051) 20061) 2007
Sales 6,013 6,448 6,470
Sales growth
% increase, nominal 9 7 0
% increase, comparable 8 8 4
EBITA 768 861 875
as a % of sales 12.8 13.4 13.5
EBIT 688 734 743
as a % of sales 11.4 11.4 11.5
Net operating capital (NOC) 3,179 4,125 4,104
Cash ows before nancing activities
505 (427) 420
Employees (FTEs) 24,221 26,203 27,441
1) Restated to present the MedQuist business as a discontinued operation
For a reconciliation to the most directly comparable US GAAP measures,
see the chapter Reconciliation of non-US GAAP information
Sales per market cluster
in millions of euros
7,500
5,000
2,500
0380
1,593
2,801
470
20031)
5,557
419
1,636
2,658
475
20041)
5,517
598
1,692
2,810
565
20051)
6,013
624
1,704
3,053
642
20061)
6,448
653
1,767
3,047
559
2007
6,470
313 348 425 444
329
Key emerging
Other emerging
Western Europe North America
Other mature
1) Restated to present the MedQuist business as a discontinued operation
Philips Annual Report 200768
Improve service satisfaction
Service satisfaction continues to be a focal area for
us. Serviceability features that allow quick problem
resolution have been designed-in to all product lines
using a new standardized process. The process has
yielded a 30% improvement in serviceability features
over the last three product release cycles.
We also implemented a robust business management
system designed to take operational performance
to world-class level. This system is founded upon the
integrated application of Philips Business Excellence/
Process Survey Tools, Six Sigma, Breakthrough Management
(Hoshin) and, specically, extensive benchmarking.
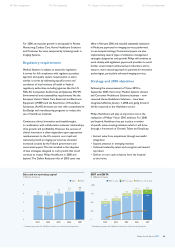
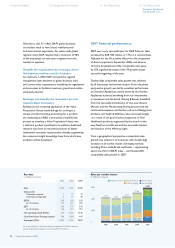
2007 nancial performance
Sales in 2007 totaled EUR 6,470 million, a stable
nominal performance compared to 2006. Excluding
the 2% positive impact of portfolio changes and the 5%
unfavorable currency effect, comparable sales growth
was 4%. Particularly strong growth in Ultrasound &
Monitoring and Customer Services was partly offset
by the decline in Imaging Systems which was negatively
affected by the continued softening of the imaging market
in the US, in part a result of the impact of the Decit
Reduction Act, and in Japan.
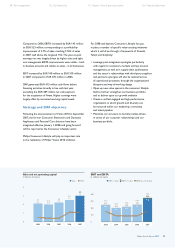
From a regional perspective, single-digit comparable sales
growth was achieved in the mature markets, including
North America, which generated double-digit growth
in all businesses except Imaging Systems. The key emerging
markets experienced 10% comparable growth, with
particularly strong performance in India (17%) and
solid growth of 9% each in China and Latin America.
EBITA amounted to EUR 875 million or 13.5% of sales
in 2007, compared to EUR 861 million or 13.4% in 2006.
Earnings fell short of the divisional target of 14-15%, as
higher earnings at Ultrasound & Monitoring, Customer
Services and Healthcare Informatics were largely offset
by lower sales-driven earnings at Imaging Systems,
partly due to the impact of the Decit Reduction Act.
EBIT improved from EUR 734 million in 2006 to
EUR 743 million in 2007.
Cash ows before nancing activities included net
payments totaling EUR 70 million for the acquisitions
of Emergin, VMI and XIMIS in 2007, while 2006 included
acquisition-related cash outows of EUR 1,103 million,
for Intermagnetics and Witt Biomedical. Excluding these
acquisition-related disbursements, cash ows before
nancing activities were EUR 186 million below 2006,
mainly due to higher working capital requirements and
increased capital expenditures.
8 Financial highlights 10 Message from the President 16 The Philips Group 62 The Philips sectors
Medical Systems