Philips 2007 Annual Report Download - page 74
Download and view the complete annual report
Please find page 74 of the 2007 Philips annual report below. You can navigate through the pages in the report by either clicking on the pages listed below, or by using the keyword search tool below to find specific information within the annual report.-
 1
1 -
2
-
3
-
4
-
5
-
6
-
7
-
8
-
9
-
10
-
11
-
12
-
13
-
14
-
15
-
16
-
17
-
18
-
19
-
20
-
21
-
22
-
23
-
24
-
25
-
26
-
27
-
28
-
29
-
30
-
31
-
32
-
33
-
34
-
35
-
36
-
37
-
38
-
39
-
40
-
41
-
42
-
43
-
44
-
45
-
46
-
47
-
48
-
49
-
50
-
51
-
52
-
53
-
54
-
55
-
56
-
57
-
58
-
59
-
60
-
61
-
62
-
63
-
 64
64 -
 65
65 -
 66
66 -
 67
67 -
 68
68 -
 69
69 -
 70
70 -
 71
71 -
 72
72 -
 73
73 -
 74
74 -
 75
75 -
 76
76 -
 77
77 -
 78
78 -
 79
79 -
 80
80 -
 81
81 -
 82
82 -
 83
83 -
 84
84 -
85
-
86
-
87
-
88
-
89
-
90
-
91
-
92
-
93
-
94
-
95
-
96
-
97
-
98
-
99
-
100
-
101
-
102
-
103
-
104
-
105
-
106
-
107
-
108
-
109
-
110
-
111
-
112
-
113
-
114
-
115
-
116
-
117
-
118
-
119
-
120
-
121
-
122
-
123
-
124
-
125
-
126
-
127
-
128
-
129
-
130
-
131
-
132
-
133
-
134
-
135
-
136
-
137
-
138
-
139
-
140
-
141
-
142
-
143
-
144
-
145
-
146
-
147
-
148
-
149
-
150
-
151
-
152
-
153
-
154
-
155
-
156
-
157
-
158
-
159
-
160
-
161
-
162
-
163
-
164
-
165
-
166
-
167
-
168
-
169
-
170
-
171
-
172
-
173
-
174
-
175
-
176
-
177
-
178
-
179
-
180
-
181
-
182
-
183
-
184
-
185
-
186
-
187
-
188
-
189
-
190
-
191
-
192
-
193
-
194
-
195
-
196
-
197
-
198
-
199
-
200
-
201
-
202
-
203
-
204
-
205
-
206
-
207
-
208
-
209
-
210
-
211
-
212
-
213
-
214
-
215
-
216
-
217
-
218
-
219
-
220
-
221
-
222
-
223
-
224
-
225
-
226
-
227
-
228
-
229
-
230
-
231
-
232
-
233
-
234
-
235
-
236
-
237
-
238
-
239
-
240
-
241
-
242
-
243
-
244
-
245
-
246
-
247
-
248
-
249
-
250
-
251
-
252
-
253
-
254
-
255
-
256
-
257
-
258
-
259
-
260
-
261
-
262
 |
 |

Philips Annual Report 200780 Philips Annual Report 200780
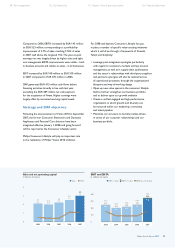
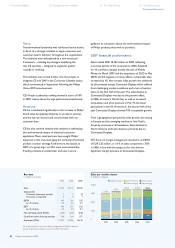
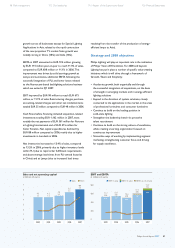
Sales per market cluster
in millions of euros
12,000
9,000
6,000
3,000
0
1,570
986
4,284
2,131
217
2003
9,188
1,949
1,196
4,338
2,011
425
2004
9,919
2,257
1,319
4,098
2,525
223
2005
10,422
2,215
1,399
4,275
2,496
191
2006
10,576
1,962
1,541
4,483
2,153
223
2007
10,362
Key emerging
Other emerging
Western Europe
North America
Other mature
guidance to consumers about the environmental impact
of Philips products they wish to purchase.
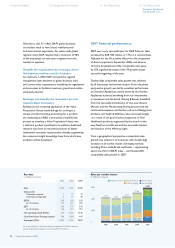
2007 nancial performance
Sales totaled EUR 10,362 million in 2007, reecting
a nominal decline of 2% compared to 2006. Adjusted
for 1% portfolio changes (mainly the sale of Mobile
Phones in March 2007 and the acquisition of DLO in May
2007) and 2% negative currency effects, comparable sales
increased by 1%. Year-on-year sales growth was delivered
by all businesses except Connected Displays, which suffered
from challenging market conditions and a loss of market
share in the rst half of the year. The sales decline at
Connected Displays was due to the positive effect,
in 2006, of soccer’s World Cup, as well as increased
competition and price pressure in Flat TV, the latter
particularly in the US. However, in the second half of the
year Connected Displays showed 10% comparable growth.
From a geographical perspective, sales growth was strong
in Europe and the emerging markets in Asia Pacic,
driven by increases in all businesses. Sales declined in
North America and Latin America, primarily due to
Connected Displays.
CE’s focus on margin management resulted in an EBITA
of EUR 325 million, or 3.1% of sales, compared to 3.0%
in 2006, in line with the target set for the division.
Signicant margin pressure at Connected Displays,
Talent
Transformational leadership was reinforced by the launch,
in April, of a strategic initiative to apply consumer and
customer-centric behavior throughout the organization.
This initiative was underpinned by a new structural
framework – entailing key changes simplifying the
way CE operates – designed to engender greater
‘outside-in’ thinking.
This initiative was carried further into the project to
integrate CE and DAP in the Consumer Lifestyle sector,
which commenced in September following the Philips
Vision 2010 announcement.
CE’s People Leadership ranking showed a score of 76%
in 2007, clearly above the high-performance benchmark.
Simplicity
CE has contributed signicantly to the increase in Philips’
brand value by applying simplicity to products, services
and the way we interact and communicate with our
customer base.
CE has also worked directly with retailers in addressing
the environmental impact of electrical consumer
appliances. Major retail partners have sought Philips’
expertise in this area, leveraging the company’s EcoVision
product creation strategy. Furthermore, the launch, in
2007, of a ‘green logo’ on CE’s most environmentally-
friendly products provided clear and easy in-store
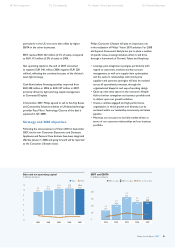
Key data
in millions of euros
2005 2006 2007
Sales 10,422 10,576 10,362
Sales growth
% increase (decrease), nominal 5 1 (2)
% increase, comparable 5 5 1
EBITA 405 314 325
as a % of sales 3.9 3.0 3.1
EBIT 404 313 322
as a % of sales 3.9 3.0 3.1
Net operating capital (NOC) (296) (228) (246)
Cash ows before nancing activities
548 248 357
Employees (FTEs) 15,537 14,486 13,516
For a reconciliation to the most directly comparable US GAAP measures,
see the chapter Reconciliation of non-US GAAP information
8 Financial highlights 10 Message from the President 16 The Philips Group 62 The Philips sectors
Consumer Electronics