Philips 2007 Annual Report Download - page 45
Download and view the complete annual report
Please find page 45 of the 2007 Philips annual report below. You can navigate through the pages in the report by either clicking on the pages listed below, or by using the keyword search tool below to find specific information within the annual report.-
 1
1 -
2
-
3
-
4
-
5
-
6
-
7
-
8
-
9
-
10
-
11
-
12
-
13
-
14
-
15
-
16
-
17
-
18
-
19
-
20
-
21
-
22
-
23
-
24
-
25
-
26
-
27
-
28
-
29
-
30
-
31
-
32
-
33
-
34
-
 35
35 -
 36
36 -
 37
37 -
 38
38 -
 39
39 -
 40
40 -
 41
41 -
 42
42 -
 43
43 -
 44
44 -
 45
45 -
 46
46 -
 47
47 -
 48
48 -
 49
49 -
 50
50 -
 51
51 -
 52
52 -
 53
53 -
 54
54 -
 55
55 -
56
-
57
-
58
-
59
-
60
-
61
-
62
-
63
-
64
-
65
-
66
-
67
-
68
-
69
-
70
-
71
-
72
-
73
-
74
-
75
-
76
-
77
-
78
-
79
-
80
-
81
-
82
-
83
-
84
-
85
-
86
-
87
-
88
-
89
-
90
-
91
-
92
-
93
-
94
-
95
-
96
-
97
-
98
-
99
-
100
-
101
-
102
-
103
-
104
-
105
-
106
-
107
-
108
-
109
-
110
-
111
-
112
-
113
-
114
-
115
-
116
-
117
-
118
-
119
-
120
-
121
-
122
-
123
-
124
-
125
-
126
-
127
-
128
-
129
-
130
-
131
-
132
-
133
-
134
-
135
-
136
-
137
-
138
-
139
-
140
-
141
-
142
-
143
-
144
-
145
-
146
-
147
-
148
-
149
-
150
-
151
-
152
-
153
-
154
-
155
-
156
-
157
-
158
-
159
-
160
-
161
-
162
-
163
-
164
-
165
-
166
-
167
-
168
-
169
-
170
-
171
-
172
-
173
-
174
-
175
-
176
-
177
-
178
-
179
-
180
-
181
-
182
-
183
-
184
-
185
-
186
-
187
-
188
-
189
-
190
-
191
-
192
-
193
-
194
-
195
-
196
-
197
-
198
-
199
-
200
-
201
-
202
-
203
-
204
-
205
-
206
-
207
-
208
-
209
-
210
-
211
-
212
-
213
-
214
-
215
-
216
-
217
-
218
-
219
-
220
-
221
-
222
-
223
-
224
-
225
-
226
-
227
-
228
-
229
-
230
-
231
-
232
-
233
-
234
-
235
-
236
-
237
-
238
-
239
-
240
-
241
-
242
-
243
-
244
-
245
-
246
-
247
-
248
-
249
-
250
-
251
-
252
-
253
-
254
-
255
-
256
-
257
-
258
-
259
-
260
-
261
-
262
 |
 |

Philips Annual Report 2007 51
Other changes resulting from consolidation and currency
effects led to a reduction of EUR 181 million.
Long-term debt as a proportion of the total debt stood
at 34% at the end of 2007, compared to 78% at the end
of 2006.
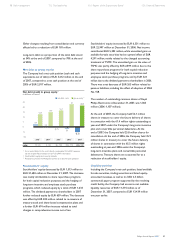
Net debt to group equity
The Company had a net cash position (cash and cash
equivalents, net of debt) of EUR 5,212 million at the end
of 2007, compared to a net cash position at the end of
2006 of EUR 2,017 million.
Net debt (cash) to group equity 1)
in billions of euros
net debt (cash)
group equity
2)
25
20
15
10
5
0
(5)
(10)
2.9
12.8
19 : 81
20033)
0.3
14.9
2 : 98
20043)
(0.7)
16.7
(4) : 104
20053)
(2)
23
(10) : 110
20063)
(5.2)
21.7
(32) : 132
2007
ratio:
1) For a reconciliation to the most directly comparable US GAAP measures,
see the chapter Reconciliation of non-US GAAP information
2) Stockholders’ equity and minority interests
3) Restated to present the MedQuist business as a discontinued operation
Stockholders’ equity
Stockholders’ equity decreased by EUR 1,313 million to
EUR 21,684 million at December 31, 2007. The decrease
was mainly attributable to share repurchase programs
for both capital reduction purposes and the hedging of
long-term incentive and employee stock purchase
programs, which reduced equity by a total of EUR 1,633
million. The dividend payment to shareholders in 2007
further reduced equity by EUR 659 million. The decrease
was offset by EUR 305 million related to re-issuance of
treasury stock and share-based compensation plans and
a further EUR 674 million increase related to total
changes in comprehensive income net of tax.
Stockholders’ equity increased by EUR 6,331 million to
EUR 22,997 million at December 31, 2006. Net income
contributed EUR 5,383 million, while unrealized gains on
available-for-sale securities had an upward effect of EUR
4,291 million, mainly related to the changed accounting
treatment of TSMC. The unrealized gain on the value of
TSMC was partly offset by EUR 2,899 million due to the
share repurchase programs for both capital reduction
purposes and the hedging of long-term incentive and
employee stock purchase programs, and by EUR 523
million due to the dividend payment to shareholders in 2006.
There was a net decrease of EUR 263 million related to
pension liabilities, including the effect of adoption of SFAS
No. 158.
The number of outstanding common shares of Royal
Philips Electronics at December 31, 2007, was 1,065
million (2006: 1,107 million).
At the end of 2007, the Company held 52.1 million
shares in treasury to cover the future delivery of shares
in connection with the 61.4 million rights outstanding at
year-end 2007 under the Company’s long-term incentive
plan and convertible personnel debentures. At the
end of 2007, the Company held 25.8 million shares for
cancellation. At the end of 2006, the Company held 35.9
million shares in treasury to cover the future delivery
of shares in connection with the 65.5 million rights
outstanding at year-end 2006 under the Company’s
long-term incentive plans and convertible personnel
debentures. Treasury shares are accounted for as a
reduction of stockholders’ equity.
Liquidity position
Including the Company’s net cash position, listed available
for-sale securities, trading securities and listed equity-
accounted investees, as well as its USD 2.5 billion
commercial paper program supported by the revolving
credit facility, the Company had access to net available
liquidity resources of EUR 11,374 million as of
December 31, 2007, compared to EUR 13,439 million
one year earlier.
98 Risk management 112 Our leadership 116 Report of the Supervisory Board 126 Financial Statements