Philips 2007 Annual Report Download - page 128
Download and view the complete annual report
Please find page 128 of the 2007 Philips annual report below. You can navigate through the pages in the report by either clicking on the pages listed below, or by using the keyword search tool below to find specific information within the annual report.-
 1
1 -
2
-
3
-
4
-
5
-
6
-
7
-
8
-
9
-
10
-
11
-
12
-
13
-
14
-
15
-
16
-
17
-
18
-
19
-
20
-
21
-
22
-
23
-
24
-
25
-
26
-
27
-
28
-
29
-
30
-
31
-
32
-
33
-
34
-
35
-
36
-
37
-
38
-
39
-
40
-
41
-
42
-
43
-
44
-
45
-
46
-
47
-
48
-
49
-
50
-
51
-
52
-
53
-
54
-
55
-
56
-
57
-
58
-
59
-
60
-
61
-
62
-
63
-
64
-
65
-
66
-
67
-
68
-
69
-
70
-
71
-
72
-
73
-
74
-
75
-
76
-
77
-
78
-
79
-
80
-
81
-
82
-
83
-
84
-
85
-
86
-
87
-
88
-
89
-
90
-
91
-
92
-
93
-
94
-
95
-
96
-
97
-
98
-
99
-
100
-
101
-
102
-
103
-
104
-
105
-
106
-
107
-
108
-
109
-
110
-
111
-
112
-
113
-
114
-
115
-
116
-
117
-
 118
118 -
 119
119 -
 120
120 -
 121
121 -
 122
122 -
 123
123 -
 124
124 -
 125
125 -
 126
126 -
 127
127 -
 128
128 -
 129
129 -
 130
130 -
 131
131 -
 132
132 -
 133
133 -
 134
134 -
 135
135 -
 136
136 -
 137
137 -
 138
138 -
139
-
140
-
141
-
142
-
143
-
144
-
145
-
146
-
147
-
148
-
149
-
150
-
151
-
152
-
153
-
154
-
155
-
156
-
157
-
158
-
159
-
160
-
161
-
162
-
163
-
164
-
165
-
166
-
167
-
168
-
169
-
170
-
171
-
172
-
173
-
174
-
175
-
176
-
177
-
178
-
179
-
180
-
181
-
182
-
183
-
184
-
185
-
186
-
187
-
188
-
189
-
190
-
191
-
192
-
193
-
194
-
195
-
196
-
197
-
198
-
199
-
200
-
201
-
202
-
203
-
204
-
205
-
206
-
207
-
208
-
209
-
210
-
211
-
212
-
213
-
214
-
215
-
216
-
217
-
218
-
219
-
220
-
221
-
222
-
223
-
224
-
225
-
226
-
227
-
228
-
229
-
230
-
231
-
232
-
233
-
234
-
235
-
236
-
237
-
238
-
239
-
240
-
241
-
242
-
243
-
244
-
245
-
246
-
247
-
248
-
249
-
250
-
251
-
252
-
253
-
254
-
255
-
256
-
257
-
258
-
259
-
260
-
261
-
262
 |
 |

Philips Annual Report 2007134
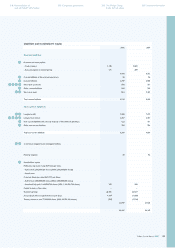
Consolidated statements of cash ows of the Philips Group for the years ended December 31
in millions of euros unless otherwise stated
2005 2006 2007
Cash ows from operating activities
Net income 2,868 5,383 4,168
Loss (income) from discontinued operations 11 (4,482) 433
Adjustments to reconcile net income to net cash provided by operating activities:
Depreciation and amortization 713 810 851
Impairment of equity-accounted investees and available-for-sale securities 427 8 39
Net gain on sale of assets (2,104) (289) (3,159)
(Income) loss from equity-accounted investees (636) 228 (249)
Dividends received from equity-accounted investees 312 − 48
Minority interests (net of dividends paid) 29 3 5
Increase in receivables and other current assets (182) (1,354) (439)
(Increase) decrease in inventories (235) 2 (389)
Increase (decrease) in accounts payable, accrued and other liabilities 302 (20) 186
Increase in non-current receivables/other assets (250) (55) (143)
(Decrease) increase in provisions (140) 83 (65)
Proceeds from sales of trading securities − − 196
Other items 32 13 37
Net cash provided by operating activities 1,147 330 1,519
Cash ows from investing activities
Purchase of intangible assets (74) (101) (118)
Capital expenditures on property, plant and equipment (637) (694) (661)
Proceeds from disposals of property, plant and equipment 212 107 81
Cash from (to) derivatives (46) 62 385
Purchase of other non-current nancial assets (18) (31) (17)
Proceeds from other non-current nancial assets 630 4 4,105
Purchase of businesses, net of cash acquired (1,089) (2,467) (1,485)
Proceeds from sale of interests in businesses 2,716 318 1,640
Net cash provided by (used for) investing activities 1,694 (2,802) 3,930
Cash ows from nancing activities
(Decrease) increase in short-term debt (36) 97 (158)
Principal payments on long-term debt (362) (543) (152)
Proceeds from issuance of long-term debt 74 9 29
Treasury stock transactions (1,761) (2,755) (1,448)
Dividends paid (504) (523) (639)
Net cash used for nancing activities (2,589) (3,715) (2,368)
Net cash provided by (used for) continuing operations 252 (6,187) 3,081
Cash ows from discontinued operations
Net cash provided by (used for) operating activities 942 524 (153)
Net cash (used for) provided by investing activities (409) 6,590 38
Net cash provided by (used for) nancing activities − − −
Net cash provided by (used for) discontinued operations 533 7,114 (115)
Net cash provided by continuing and discontinued operations 785 927 2,966
Effect of changes in exchange rates on cash positions 159 (197) (112)
Cash and cash equivalents at the beginning of the year 4,349 5,293 6,023
Cash and cash equivalents at the end of the year 5,293 6,023 8,877
Less cash and cash equivalents at the end of the year - discontinued operations 150 137 108
Cash and cash equivalents at the end of the year - continuing operations 5,143 5,886 8,769
The years 2005 and 2006 are restated to present the MedQuist business as a discontinued operation.
The accompanying notes are an integral part of these consolidated nancial statements.
29
30
128 Group nancial statements
Consolidated statements of cash ows
188 IFRS information 240 Company nancial statements