Philips 2007 Annual Report Download - page 153
Download and view the complete annual report
Please find page 153 of the 2007 Philips annual report below. You can navigate through the pages in the report by either clicking on the pages listed below, or by using the keyword search tool below to find specific information within the annual report.-
 1
1 -
2
-
3
-
4
-
5
-
6
-
7
-
8
-
9
-
10
-
11
-
12
-
13
-
14
-
15
-
16
-
17
-
18
-
19
-
20
-
21
-
22
-
23
-
24
-
25
-
26
-
27
-
28
-
29
-
30
-
31
-
32
-
33
-
34
-
35
-
36
-
37
-
38
-
39
-
40
-
41
-
42
-
43
-
44
-
45
-
46
-
47
-
48
-
49
-
50
-
51
-
52
-
53
-
54
-
55
-
56
-
57
-
58
-
59
-
60
-
61
-
62
-
63
-
64
-
65
-
66
-
67
-
68
-
69
-
70
-
71
-
72
-
73
-
74
-
75
-
76
-
77
-
78
-
79
-
80
-
81
-
82
-
83
-
84
-
85
-
86
-
87
-
88
-
89
-
90
-
91
-
92
-
93
-
94
-
95
-
96
-
97
-
98
-
99
-
100
-
101
-
102
-
103
-
104
-
105
-
106
-
107
-
108
-
109
-
110
-
111
-
112
-
113
-
114
-
115
-
116
-
117
-
118
-
119
-
120
-
121
-
122
-
123
-
124
-
125
-
126
-
127
-
128
-
129
-
130
-
131
-
132
-
133
-
134
-
135
-
136
-
137
-
138
-
139
-
140
-
141
-
142
-
 143
143 -
 144
144 -
 145
145 -
 146
146 -
 147
147 -
 148
148 -
 149
149 -
 150
150 -
 151
151 -
 152
152 -
 153
153 -
 154
154 -
 155
155 -
 156
156 -
 157
157 -
 158
158 -
 159
159 -
 160
160 -
 161
161 -
 162
162 -
 163
163 -
164
-
165
-
166
-
167
-
168
-
169
-
170
-
171
-
172
-
173
-
174
-
175
-
176
-
177
-
178
-
179
-
180
-
181
-
182
-
183
-
184
-
185
-
186
-
187
-
188
-
189
-
190
-
191
-
192
-
193
-
194
-
195
-
196
-
197
-
198
-
199
-
200
-
201
-
202
-
203
-
204
-
205
-
206
-
207
-
208
-
209
-
210
-
211
-
212
-
213
-
214
-
215
-
216
-
217
-
218
-
219
-
220
-
221
-
222
-
223
-
224
-
225
-
226
-
227
-
228
-
229
-
230
-
231
-
232
-
233
-
234
-
235
-
236
-
237
-
238
-
239
-
240
-
241
-
242
-
243
-
244
-
245
-
246
-
247
-
248
-
249
-
250
-
251
-
252
-
253
-
254
-
255
-
256
-
257
-
258
-
259
-
260
-
261
-
262
 |
 |

Philips Annual Report 2007 159
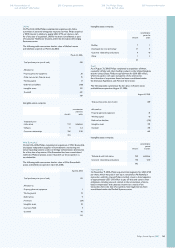
8
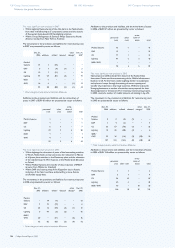
Earnings per share
The earnings per share (EPS) data have been calculated as follows:
2005 2006 2007
Net income
Income from continuing operations 2,879 901 4,601
Income (loss) from discontinued operations (11) 4,482 (433)
Net income available to holders of common shares 2,868 5,383 4,168
Weighted average number of shares 1,249,955,546 1,174,924,579 1,086,128,418
Plus incremental share from assumed conversions of:
Options and restricted share rights 2,771,955 6,817,690 10,203,409
Convertible debentures 602,863 1,042,061 1,103,117
Dilutive potential common shares1) 3,374,818 7,859,751 11,306,526
Adjusted weighted average number of shares 1,253,330,364 1,182,784,330 1,097,434,944
Basic earnings per share in euros
Income from continuing operations 2.30 0.77 4.24
Income (loss) from discontinued operations (0.01) 3.81 (0.40)
Net income 2.29 4.58 3.84
Diluted earnings per share in euros
Income from continuing operations 2.30 0.76 4.19
Income (loss) from discontinued operations (0.01) 3.79 (0.39)
Net income 2.29 4.55 3.80
1) In 2007, 27 million securities (2006: 19 million, 2005: 34 million) that could potentially dilute basic EPS were not included in the computation of dilutive EPS because
the effect would have been antidilutive for the periods presented.
8
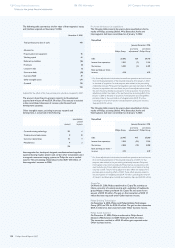
9
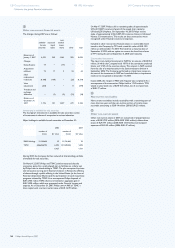
Receivables
Accounts receivable, net, include installment accounts receivable
of EUR 3 million (2006: EUR 8 million).
Income taxes receivable (current portion) totaling EUR 52 million
(2006: EUR 105 million) are included under other receivables.
The changes in the allowance for doubtful accounts receivable
are as follows:
2005 2006 2007
Balance as of January 1 404 369 336
Additions charged to income 30 52 62
Deductions from allowance1) (62) (72) (85)
Other movements2) (3) (13) (13)
Balance as of December 31 369 336 300
1) Write-offs for which an allowance was previously provided
2) Including the effect of translation differences and consolidation changes
9
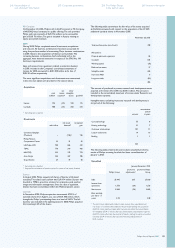
10
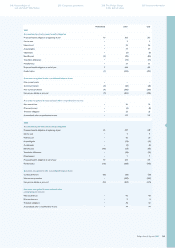
Inventories
Inventories are summarized as follows:
2006 2007
Raw materials and supplies 849 918
Work in process 380 391
Finished goods 1,859 2,015
Advance payments on work in process (208) (121)
2,880 3,203
The amounts recorded above are net of allowances for obsolescence.
As of December 31, 2007, the carrying amount of inventories carried
at fair value less cost-to-sell is EUR 190 million (2006: EUR 116 million).
11
Other current assets
Other current assets consist of a current deferred tax asset of
EUR 399 million (2006: EUR 489 million), derivative instruments assets
of EUR 275 million (2006: EUR 298 million), prepaid expenses of
EUR 346 million (2006: EUR 279 million) and held-for-trading securities
of EUR nil (2006: EUR 192 million).
10
11
Group nancial statements
Notes to the group nancial statements
Company nancial statements 250 Corporate governance246 Reconciliation of
non-US GAAP information 258 The Philips Group
in the last ten years 260
Investor information