Yahoo 2015 Annual Report Download - page 101
Download and view the complete annual report
Please find page 101 of the 2015 Yahoo annual report below. You can navigate through the pages in the report by either clicking on the pages listed below, or by using the keyword search tool below to find specific information within the annual report.-
 1
1 -
2
-
3
-
4
-
5
-
6
-
7
-
8
-
9
-
10
-
11
-
12
-
13
-
14
-
15
-
16
-
17
-
18
-
19
-
20
-
21
-
22
-
23
-
24
-
25
-
26
-
27
-
28
-
29
-
30
-
31
-
32
-
33
-
34
-
35
-
36
-
37
-
38
-
39
-
40
-
41
-
42
-
43
-
44
-
45
-
46
-
47
-
48
-
49
-
50
-
51
-
52
-
53
-
54
-
55
-
56
-
57
-
58
-
59
-
60
-
61
-
62
-
63
-
64
-
65
-
66
-
67
-
68
-
69
-
70
-
71
-
72
-
73
-
74
-
75
-
76
-
77
-
78
-
79
-
80
-
81
-
82
-
83
-
84
-
85
-
86
-
87
-
88
-
89
-
90
-
 91
91 -
 92
92 -
 93
93 -
 94
94 -
 95
95 -
 96
96 -
 97
97 -
 98
98 -
 99
99 -
 100
100 -
 101
101 -
 102
102 -
 103
103 -
 104
104 -
 105
105 -
 106
106 -
 107
107 -
 108
108 -
 109
109 -
 110
110 -
 111
111 -
112
-
113
-
114
-
115
-
116
-
117
-
118
-
119
-
120
-
121
-
122
-
123
-
124
-
125
-
126
-
127
-
128
-
129
-
130
-
131
-
132
-
133
-
134
-
135
-
136
-
137
-
138
-
139
-
140
-
141
-
142
-
143
-
144
-
145
-
146
-
147
-
148
-
149
-
150
-
151
-
152
-
153
-
154
-
155
-
156
-
157
-
158
-
159
-
160
-
161
-
162
-
163
-
164
-
165
-
166
-
167
-
168
-
169
-
170
-
171
-
172
-
173
-
174
-
175
-
176
-
177
-
178
-
179
-
180
 |
 |
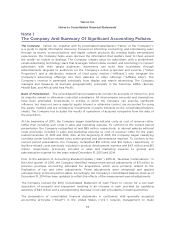
statements of operations. The fair values of the balance sheet hedges are determined using quoted
observable inputs.
The Company recognizes all derivative instruments as other assets or liabilities on the Company’s
consolidated balance sheets at fair value. See Note 9—“Foreign Currency Derivative Financial
Instruments” for a full description of the Company’s derivative financial instrument activities and
related accounting.
Property and Equipment. Buildings are stated at cost and depreciated using the straight-line
method over the estimated useful lives of 25 years. Leasehold improvements are amortized over the
lesser of their expected useful lives and the remaining lease term. Computers and equipment and
furniture and fixtures are stated at cost and depreciated using the straight-line method over the
estimated useful lives of the assets, generally three to five years.
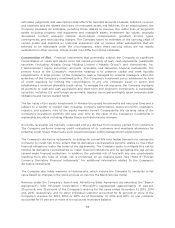
Property and equipment to be held and used are reviewed for impairment whenever events or
changes in circumstances indicate that the carrying value of the assets may not be recoverable.
Determination of recoverability is based on the lowest level of identifiable estimated undiscounted
future cash flows resulting from the use of the asset and its eventual disposition. Measurement of any
impairment loss for long-lived assets that management expects to hold and use is based on the
excess of the carrying value of the asset over its fair value. No impairments of such assets were
identified during any of the periods presented.
Capitalized Software and Labor. The Company capitalized certain software and labor costs totaling
approximately $130 million, $85 million, and $31 million during 2013, 2014, and 2015, respectively. The
Company capitalizes eligible costs to acquire or develop internal-use software that are incurred
subsequent to the preliminary project stage through the development stage. The estimated useful life
of costs capitalized is evaluated for each specific project and ranges from one to three years. Actual
economic lives may differ from estimated useful lives. Periodic reviews could result in a change in
estimated useful lives and therefore amortization expense in future periods. During 2013, 2014, and
2015, the amortization of capitalized costs totaled approximately $175 million, $161 million, and $144
million, respectively. Capitalized software and labor costs are included in property and equipment,
net. Included in the capitalized amounts above are $16 million, $12 million, and $5 million, respectively,
of stock-based compensation expense in the years ended December 31, 2013, 2014, and 2015.
Goodwill. Goodwill represents the excess of the purchase price over the fair value of the net
tangible and intangible assets acquired in a business combination. Goodwill is not amortized, but is
tested for impairment on an annual basis and more frequently if impairment indicators are present.
The Company’s reporting units are one level below the operating segments level. The reporting unit’s
carrying value is compared to its fair value. The estimated fair values of the reporting units are
determined using either the market approach, income approach or a combination of the market and
income approach. Goodwill is considered impaired if the carrying value of the reporting unit exceeds
its estimated fair value. The income approach uses expected future operating results and failure to
achieve these expected results may cause a future impairment of goodwill at the reporting unit. If the
carrying value of the reporting unit exceeds its estimated fair value, the second step of the goodwill
impairment test is performed by comparing the carrying value of the goodwill in the reporting unit to
its implied fair value. The implied fair value is calculated by allocating all of the assets and liabilities of
the reporting unit, including any unrecognized intangible assets, in a hypothetical analysis that
calculates the implied fair value of goodwill in the same manner as if the reporting unit was being
acquired in a business combination. An impairment charge is recognized for the excess of the
carrying value of goodwill over its implied estimated fair value. The Company conducts its annual
goodwill impairment test as of October 31, 2015. See Note 5—“Goodwill” for results of the goodwill
impairment test.
97