Yahoo 2015 Annual Report Download - page 91
Download and view the complete annual report
Please find page 91 of the 2015 Yahoo annual report below. You can navigate through the pages in the report by either clicking on the pages listed below, or by using the keyword search tool below to find specific information within the annual report.-
 1
1 -
2
-
3
-
4
-
5
-
6
-
7
-
8
-
9
-
10
-
11
-
12
-
13
-
14
-
15
-
16
-
17
-
18
-
19
-
20
-
21
-
22
-
23
-
24
-
25
-
26
-
27
-
28
-
29
-
30
-
31
-
32
-
33
-
34
-
35
-
36
-
37
-
38
-
39
-
40
-
41
-
42
-
43
-
44
-
45
-
46
-
47
-
48
-
49
-
50
-
51
-
52
-
53
-
54
-
55
-
56
-
57
-
58
-
59
-
60
-
61
-
62
-
63
-
64
-
65
-
66
-
67
-
68
-
69
-
70
-
71
-
72
-
73
-
74
-
75
-
76
-
77
-
78
-
79
-
80
-
 81
81 -
 82
82 -
 83
83 -
 84
84 -
 85
85 -
 86
86 -
 87
87 -
 88
88 -
 89
89 -
 90
90 -
 91
91 -
 92
92 -
 93
93 -
 94
94 -
 95
95 -
 96
96 -
 97
97 -
 98
98 -
 99
99 -
 100
100 -
 101
101 -
102
-
103
-
104
-
105
-
106
-
107
-
108
-
109
-
110
-
111
-
112
-
113
-
114
-
115
-
116
-
117
-
118
-
119
-
120
-
121
-
122
-
123
-
124
-
125
-
126
-
127
-
128
-
129
-
130
-
131
-
132
-
133
-
134
-
135
-
136
-
137
-
138
-
139
-
140
-
141
-
142
-
143
-
144
-
145
-
146
-
147
-
148
-
149
-
150
-
151
-
152
-
153
-
154
-
155
-
156
-
157
-
158
-
159
-
160
-
161
-
162
-
163
-
164
-
165
-
166
-
167
-
168
-
169
-
170
-
171
-
172
-
173
-
174
-
175
-
176
-
177
-
178
-
179
-
180
 |
 |

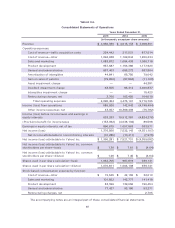
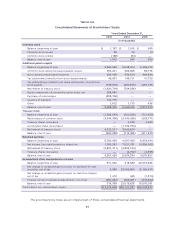
Yahoo! Inc.
Consolidated Statements of Operations
Years Ended December 31,
2013 2014 2015
(in thousands, except per share amounts)
Revenue
$ 4,680,380 $ 4,618,133 $ 4,968,301
Operating expenses:
Cost of revenue—traffic acquisition costs
254,442 217,531 877,514
Cost of revenue—other
1,094,938 1,169,844 1,200,234
Sales and marketing
1,083,872 1,084,438 1,080,718
Product development
957,587 1,156,386 1,177,923
General and administrative
667,403 686,272 687,804
Amortization of intangibles
44,841 66,750 79,042
Gain on sales of patents
(79,950) (97,894) (11,100)
Asset impairment charge
— — 44,381
Goodwill impairment charge
63,555 88,414 4,460,837
Intangibles impairment charge
— — 15,423
Restructuring charges, net
3,766 103,450 104,019
Total operating expenses
4,090,454 4,475,191 9,716,795
Income (loss) from operations
589,926 142,942 (4,748,494)
Other income (expense), net
43,357 10,369,439 (75,782)
Income (loss) before income taxes and earnings in
equity interests
633,283 10,512,381 (4,824,276)
(Provision) benefit for income taxes
(153,392) (4,038,102) 89,598
Earnings in equity interests, net of tax
896,675 1,057,863 383,571
Net income (loss)
1,376,566 7,532,142 (4,351,107)
Net income attributable to noncontrolling interests
(10,285) (10,411) (7,975)
Net income (loss) attributable to Yahoo! Inc.
$ 1,366,281 $ 7,521,731 $ (4,359,082)
Net income (loss) attributable to Yahoo! Inc. common
stockholders per share—basic
$ 1.30 $ 7.61 $ (4.64)
Net income (loss) attributable to Yahoo! Inc. common
stockholders per share—diluted
$ 1.26 $ 7.45 $ (4.64)
Shares used in per share calculation—basic
1,052,705 987,819 939,141
Shares used in per share calculation—diluted
1,070,811 1,004,108 939,141
Stock-based compensation expense by function:
Cost of revenue—other
$ 15,545 $ 42,155 $ 32,010
Sales and marketing
101,852 145,777 141,418
Product development
83,396 139,056 190,454
General and administrative
77,427 93,186 93,271
Restructuring charges, net
— — 2,705
The accompanying notes are an integral part of these consolidated financial statements.
87