Yahoo 2015 Annual Report Download - page 157
Download and view the complete annual report
Please find page 157 of the 2015 Yahoo annual report below. You can navigate through the pages in the report by either clicking on the pages listed below, or by using the keyword search tool below to find specific information within the annual report.-
 1
1 -
2
-
3
-
4
-
5
-
6
-
7
-
8
-
9
-
10
-
11
-
12
-
13
-
14
-
15
-
16
-
17
-
18
-
19
-
20
-
21
-
22
-
23
-
24
-
25
-
26
-
27
-
28
-
29
-
30
-
31
-
32
-
33
-
34
-
35
-
36
-
37
-
38
-
39
-
40
-
41
-
42
-
43
-
44
-
45
-
46
-
47
-
48
-
49
-
50
-
51
-
52
-
53
-
54
-
55
-
56
-
57
-
58
-
59
-
60
-
61
-
62
-
63
-
64
-
65
-
66
-
67
-
68
-
69
-
70
-
71
-
72
-
73
-
74
-
75
-
76
-
77
-
78
-
79
-
80
-
81
-
82
-
83
-
84
-
85
-
86
-
87
-
88
-
89
-
90
-
91
-
92
-
93
-
94
-
95
-
96
-
97
-
98
-
99
-
100
-
101
-
102
-
103
-
104
-
105
-
106
-
107
-
108
-
109
-
110
-
111
-
112
-
113
-
114
-
115
-
116
-
117
-
118
-
119
-
120
-
121
-
122
-
123
-
124
-
125
-
126
-
127
-
128
-
129
-
130
-
131
-
132
-
133
-
134
-
135
-
136
-
137
-
138
-
139
-
140
-
141
-
142
-
143
-
144
-
145
-
146
-
 147
147 -
 148
148 -
 149
149 -
 150
150 -
 151
151 -
 152
152 -
 153
153 -
 154
154 -
 155
155 -
 156
156 -
 157
157 -
 158
158 -
 159
159 -
 160
160 -
 161
161 -
 162
162 -
 163
163 -
 164
164 -
 165
165 -
 166
166 -
 167
167 -
168
-
169
-
170
-
171
-
172
-
173
-
174
-
175
-
176
-
177
-
178
-
179
-
180
 |
 |

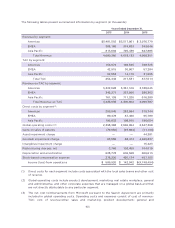
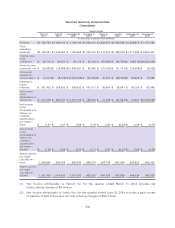
The following tables present summarized information by segment (in thousands):
Years Ended December 31,
2013 2014 2015
Revenue by segment:
Americas
$3,481,502 $3,517,861 $ 3,976,770
EMEA
385,186 374,833 343,646
Asia Pacific
813,692 725,439 647,885
Total Revenue
4,680,380 4,618,133 4,968,301
TAC by segment:
Americas
158,974 166,545 788,725
EMEA
42,915 36,867 57,284
Asia Pacific
52,553 14,119 31,505
Total TAC
254,442 217,531 877,514
Revenue ex-TAC by segment:
Americas
3,322,528 3,351,316 3,188,045
EMEA
342,271 337,966 286,362
Asia Pacific
761,139 711,320 616,380
Total Revenue ex-TAC
4,425,938 4,400,602 4,090,787
Direct costs by segment(1):
Americas
256,945 283,594 319,744
EMEA
89,478 87,490 95,789
Asia Pacific
196,832 198,910 196,054
Global operating costs(2)(3)
2,398,388 2,566,954 2,547,368
Gains on sales of patents
(79,950) (97,894) (11,100)
Asset impairment charge
— — 44,381
Goodwill impairment charge
63,555 88,414 4,460,837
Intangibles impairment charge
— — 15,423
Restructuring charges, net
3,766 103,450 104,019
Depreciation and amortization
628,778 606,568 609,613
Stock-based compensation expense
278,220 420,174 457,153
Income (loss) from operations
$ 589,926 $ 142,942 $(4,748,494)
(1) Direct costs for each segment include costs associated with the local sales teams and other cost
of revenue.
(2) Global operating costs include product development, marketing, real estate workplace, general
and administrative, and other corporate expenses that are managed on a global basis and that
are not directly attributable to any particular segment.
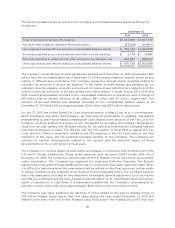
(3) The net cost reimbursements from Microsoft pursuant to the Search Agreement are primarily
included in global operating costs. Operating costs and expenses consist of cost of revenue-
TAC; cost of revenue-other; sales and marketing, product development; general and
153