Yahoo 2015 Annual Report Download - page 95
Download and view the complete annual report
Please find page 95 of the 2015 Yahoo annual report below. You can navigate through the pages in the report by either clicking on the pages listed below, or by using the keyword search tool below to find specific information within the annual report.-
 1
1 -
2
-
3
-
4
-
5
-
6
-
7
-
8
-
9
-
10
-
11
-
12
-
13
-
14
-
15
-
16
-
17
-
18
-
19
-
20
-
21
-
22
-
23
-
24
-
25
-
26
-
27
-
28
-
29
-
30
-
31
-
32
-
33
-
34
-
35
-
36
-
37
-
38
-
39
-
40
-
41
-
42
-
43
-
44
-
45
-
46
-
47
-
48
-
49
-
50
-
51
-
52
-
53
-
54
-
55
-
56
-
57
-
58
-
59
-
60
-
61
-
62
-
63
-
64
-
65
-
66
-
67
-
68
-
69
-
70
-
71
-
72
-
73
-
74
-
75
-
76
-
77
-
78
-
79
-
80
-
81
-
82
-
83
-
84
-
 85
85 -
 86
86 -
 87
87 -
 88
88 -
 89
89 -
 90
90 -
 91
91 -
 92
92 -
 93
93 -
 94
94 -
 95
95 -
 96
96 -
 97
97 -
 98
98 -
 99
99 -
 100
100 -
 101
101 -
 102
102 -
 103
103 -
 104
104 -
 105
105 -
106
-
107
-
108
-
109
-
110
-
111
-
112
-
113
-
114
-
115
-
116
-
117
-
118
-
119
-
120
-
121
-
122
-
123
-
124
-
125
-
126
-
127
-
128
-
129
-
130
-
131
-
132
-
133
-
134
-
135
-
136
-
137
-
138
-
139
-
140
-
141
-
142
-
143
-
144
-
145
-
146
-
147
-
148
-
149
-
150
-
151
-
152
-
153
-
154
-
155
-
156
-
157
-
158
-
159
-
160
-
161
-
162
-
163
-
164
-
165
-
166
-
167
-
168
-
169
-
170
-
171
-
172
-
173
-
174
-
175
-
176
-
177
-
178
-
179
-
180
 |
 |

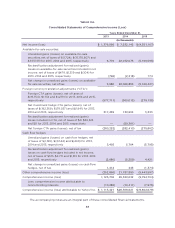
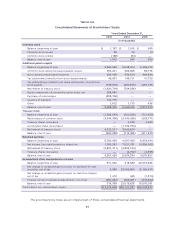
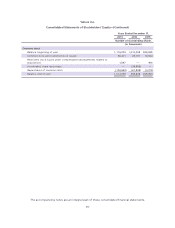
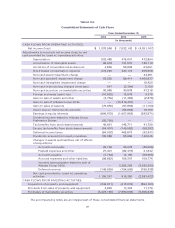
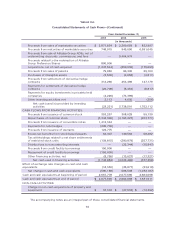
Yahoo! Inc.
Consolidated Statements of Cash Flows
Years Ended December 31,
2013 2014 2015
(in thousands)
CASH FLOWS FROM OPERATING ACTIVITIES:
Net income (loss)
$ 1,376,566 $ 7,532,142 $ (4,351,107)
Adjustments to reconcile net income (loss) to net
cash provided by (used in) operating activities:
Depreciation
532,485 475,031 472,894
Amortization of intangible assets
96,518 131,537 136,719
Accretion of convertible notes discount
4,846 59,838 63,061
Stock-based compensation expense
278,220 420,174 459,858
Non-cash asset impairment charge
— — 44,381
Non-cash goodwill impairment charge
63,555 88,414 4,460,837
Non-cash intangibles impairment charge
— — 15,423
Non-cash restructuring charges (reversals)
547 (3,394) 3,150
Non-cash accretion on marketable securities
36,985 30,878 47,218
Foreign exchange (gain) loss
(10,852) 15,978 4,376
Gain on sale of assets and other
(3,736) (11,383) (2,878)
Gain on sale of Alibaba Group ADSs
— (10,319,437) —
Gain on sales of patents
(79,950) (97,894) (11,100)
(Gain) loss on Hortonworks warrants
— (98,062) 19,199
Earnings in equity interests
(896,675) (1,057,863) (383,571)
Dividend income related to Alibaba Group
Preference Shares
(35,726) — —
Tax benefits from stock-based awards
49,061 145,711 41,729
Excess tax benefits from stock-based awards
(64,407) (149,582) (58,282)
Deferred income taxes
(84,302) 465,873 (42,341)
Dividends received from equity investees
135,058 83,685 142,045
Changes in assets and liabilities, net of effects
of acquisitions:
Accounts receivable
26,199 29,278 (39,065)
Prepaid expenses and other
27,401 (82,419) 21,842
Accounts payable
(7,764) 14,165 (59,965)
Accrued expenses and other liabilities
(98,853) 156,307 109,776
Incomes taxes payable related to sale of
Alibaba Group ADSs
— 3,282,293 (3,282,293)
Deferred revenue
(149,929) (194,920) (195,328)
Net cash provided by (used in) operating
activities
1,195,247 916,350 (2,383,422)
CASH FLOWS FROM INVESTING ACTIVITIES:
Acquisition of property and equipment
(342,971) (413,019) (554,163)
Proceeds from sales of property and equipment
4,840 17,404 11,176
Purchases of marketable securities
(3,223,190) (7,890,092) (5,206,245)
The accompanying notes are an integral part of these consolidated financial statements.
91