Yahoo 2015 Annual Report Download - page 69
Download and view the complete annual report
Please find page 69 of the 2015 Yahoo annual report below. You can navigate through the pages in the report by either clicking on the pages listed below, or by using the keyword search tool below to find specific information within the annual report.-
 1
1 -
2
-
3
-
4
-
5
-
6
-
7
-
8
-
9
-
10
-
11
-
12
-
13
-
14
-
15
-
16
-
17
-
18
-
19
-
20
-
21
-
22
-
23
-
24
-
25
-
26
-
27
-
28
-
29
-
30
-
31
-
32
-
33
-
34
-
35
-
36
-
37
-
38
-
39
-
40
-
41
-
42
-
43
-
44
-
45
-
46
-
47
-
48
-
49
-
50
-
51
-
52
-
53
-
54
-
55
-
56
-
57
-
58
-
 59
59 -
 60
60 -
 61
61 -
 62
62 -
 63
63 -
 64
64 -
 65
65 -
 66
66 -
 67
67 -
 68
68 -
 69
69 -
 70
70 -
 71
71 -
 72
72 -
 73
73 -
 74
74 -
 75
75 -
 76
76 -
 77
77 -
 78
78 -
 79
79 -
80
-
81
-
82
-
83
-
84
-
85
-
86
-
87
-
88
-
89
-
90
-
91
-
92
-
93
-
94
-
95
-
96
-
97
-
98
-
99
-
100
-
101
-
102
-
103
-
104
-
105
-
106
-
107
-
108
-
109
-
110
-
111
-
112
-
113
-
114
-
115
-
116
-
117
-
118
-
119
-
120
-
121
-
122
-
123
-
124
-
125
-
126
-
127
-
128
-
129
-
130
-
131
-
132
-
133
-
134
-
135
-
136
-
137
-
138
-
139
-
140
-
141
-
142
-
143
-
144
-
145
-
146
-
147
-
148
-
149
-
150
-
151
-
152
-
153
-
154
-
155
-
156
-
157
-
158
-
159
-
160
-
161
-
162
-
163
-
164
-
165
-
166
-
167
-
168
-
169
-
170
-
171
-
172
-
173
-
174
-
175
-
176
-
177
-
178
-
179
-
180
 |
 |

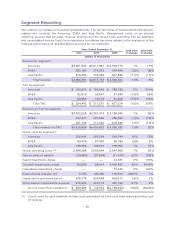
Segment Reporting
We continue to manage our business geographically. The primary areas of measurement and decision
making are currently the Americas, EMEA and Asia Pacific. Management relies on an internal
reporting process that provides revenue, revenue ex-TAC, direct costs excluding TAC by segment,
and consolidated income (loss) from operations for making decisions related to the evaluation of the
financial performance of, and allocating resources to, our segments.
Years Ended December 31, 2013-2014
% Change
2014-2015
% Change2013 2014 2015
(dollars in thousands)
Revenue by segment:
Americas
$3,481,502 $3,517,861 $ 3,976,770 1% 13%
EMEA
385,186 374,833 343,646 (3)% (8)%
Asia Pacific
813,692 725,439 647,885 (11)% (11)%
Total revenue
$4,680,380 $4,618,133 $ 4,968,301 (1)% 8%
TAC by segment:
Americas
$ 158,974 $ 166,545 $ 788,725 5% 374%
EMEA
42,915 36,867 57,284 (14)% 55%
Asia Pacific
52,553 14,119 31,505 (73)% 123%
Total TAC
$ 254,442 $ 217,531 $ 877,514 (15)% 303%
Revenue ex-TAC by segment:
Americas
$3,322,528 $3,351,316 $ 3,188,045 1% (5)%
EMEA
342,271 337,966 286,362 (1)% (15)%
Asia Pacific
761,139 711,320 616,380 (7)% (13)%
Total revenue ex-TAC
$4,425,938 $4,400,602 $ 4,090,787 (1)% (7)%
Direct costs by segment(1):
Americas
256,945 283,594 319,744 10% 13%
EMEA
89,478 87,490 95,789 (2)% 9%
Asia Pacific
196,832 198,910 196,054 1% (1)%
Global operating costs(2)(3)
2,398,388 2,566,954 2,547,368 7% (1)%
Gain on sales of patents
(79,950) (97,894) (11,100) 22% (89)%
Asset impairment charge
— — 44,381 0% 100%
Goodwill impairment charge
63,555 88,414 4,460,837 39% 4945%
Intangibles impairment charge
— — 15,423 0% 100%
Restructuring charges, net
3,766 103,450 104,019 2647% 1%
Depreciation and amortization
628,778 606,568 609,613 (4)% 1%
Stock-based compensation expense
278,220 420,174 457,153 51% 9%
Income (loss) from operations
$ 589,926 $ 142,942 $(4,748,494) (76)% (3422)%
(1) Direct costs for each segment include costs associated with the local sales teams and other cost
of revenue.
65