Yahoo 2015 Annual Report Download - page 59
Download and view the complete annual report
Please find page 59 of the 2015 Yahoo annual report below. You can navigate through the pages in the report by either clicking on the pages listed below, or by using the keyword search tool below to find specific information within the annual report.-
 1
1 -
2
-
3
-
4
-
5
-
6
-
7
-
8
-
9
-
10
-
11
-
12
-
13
-
14
-
15
-
16
-
17
-
18
-
19
-
20
-
21
-
22
-
23
-
24
-
25
-
26
-
27
-
28
-
29
-
30
-
31
-
32
-
33
-
34
-
35
-
36
-
37
-
38
-
39
-
40
-
41
-
42
-
43
-
44
-
45
-
46
-
47
-
48
-
 49
49 -
 50
50 -
 51
51 -
 52
52 -
 53
53 -
 54
54 -
 55
55 -
 56
56 -
 57
57 -
 58
58 -
 59
59 -
 60
60 -
 61
61 -
 62
62 -
 63
63 -
 64
64 -
 65
65 -
 66
66 -
 67
67 -
 68
68 -
 69
69 -
70
-
71
-
72
-
73
-
74
-
75
-
76
-
77
-
78
-
79
-
80
-
81
-
82
-
83
-
84
-
85
-
86
-
87
-
88
-
89
-
90
-
91
-
92
-
93
-
94
-
95
-
96
-
97
-
98
-
99
-
100
-
101
-
102
-
103
-
104
-
105
-
106
-
107
-
108
-
109
-
110
-
111
-
112
-
113
-
114
-
115
-
116
-
117
-
118
-
119
-
120
-
121
-
122
-
123
-
124
-
125
-
126
-
127
-
128
-
129
-
130
-
131
-
132
-
133
-
134
-
135
-
136
-
137
-
138
-
139
-
140
-
141
-
142
-
143
-
144
-
145
-
146
-
147
-
148
-
149
-
150
-
151
-
152
-
153
-
154
-
155
-
156
-
157
-
158
-
159
-
160
-
161
-
162
-
163
-
164
-
165
-
166
-
167
-
168
-
169
-
170
-
171
-
172
-
173
-
174
-
175
-
176
-
177
-
178
-
179
-
180
 |
 |

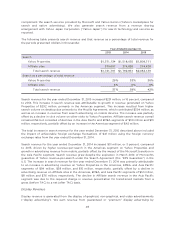
Cost of revenue—other increased $75 million, or 7 percent, for the year ended December 31, 2014,
compared to 2013, due to increases in compensation costs of $59 million, stock-based compensation
expense of $27 million and credit card fees of $5 million, partially offset by a decline in depreciation
and amortization expense of $22 million.
Sales and Marketing
Sales and marketing expenses consist primarily of advertising and other marketing-related expenses,
compensation-related expenses (including stock-based compensation expense), sales commissions,
and travel costs.
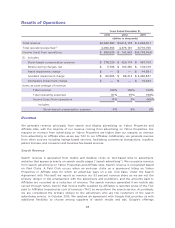
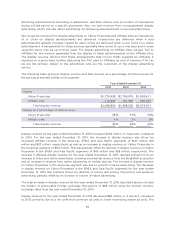
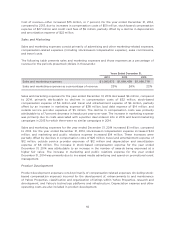
The following table presents sales and marketing expenses and those expenses as a percentage of
revenue for the periods presented (dollars in thousands):
Years Ended December 31,
2013 2014 2015
Sales and marketing expenses
$1,083,872 $1,084,438 $1,080,718
Sales and marketing expenses as a percentage of revenue
23% 24% 22%
Sales and marketing expenses for the year ended December 31, 2015 decreased $4 million, compared
to 2014, primarily attributable to declines in compensation costs of $52 million, stock-based
compensation expense of $4 million and travel and entertainment expense of $4 million, partially
offset by an increase in marketing expense of $38 million, bad debt expense of $14 million, and
outside service provider expenses of $5 million. The decline in compensation costs was primarily
attributable to a 17 percent decrease in headcount year-over-year. The increase in marketing expense
was primarily due to costs associated with a partner deal entered into in 2015 and brand marketing
campaigns in 2015 for which there were no similar campaigns in 2014.
Sales and marketing expenses for the year ended December 31, 2014 increased $1 million, compared
to 2013. For the year ended December 31, 2014, stock-based compensation expense increased $44
million, and marketing and public relations expense increased $14 million. These increases were
partially offset by declines in compensation costs of $25 million, travel and entertainment expense of
$12 million, outside service provider expenses of $12 million and depreciation and amortization
expense of $6 million. The increase in stock-based compensation expense for the year ended
December 31, 2014 was attributable to an increase in the number of awards being expensed at a
higher fair value. The increase in marketing and public relations expense for the year ended
December 31, 2014 was primarily due to increased media advertising and spend on promotional event
management.
Product Development
Product development expenses consist primarily of compensation-related expenses (including stock-
based compensation expense) incurred for the development of, enhancements to and maintenance
of Yahoo Properties, classification and organization of listings within Yahoo Properties, research and
development, and Yahoo’s technology platforms and infrastructure. Depreciation expense and other
operating costs are also included in product development.
55