Yahoo 2015 Annual Report Download - page 55
Download and view the complete annual report
Please find page 55 of the 2015 Yahoo annual report below. You can navigate through the pages in the report by either clicking on the pages listed below, or by using the keyword search tool below to find specific information within the annual report.-
 1
1 -
2
-
3
-
4
-
5
-
6
-
7
-
8
-
9
-
10
-
11
-
12
-
13
-
14
-
15
-
16
-
17
-
18
-
19
-
20
-
21
-
22
-
23
-
24
-
25
-
26
-
27
-
28
-
29
-
30
-
31
-
32
-
33
-
34
-
35
-
36
-
37
-
38
-
39
-
40
-
41
-
42
-
43
-
44
-
 45
45 -
 46
46 -
 47
47 -
 48
48 -
 49
49 -
 50
50 -
 51
51 -
 52
52 -
 53
53 -
 54
54 -
 55
55 -
 56
56 -
 57
57 -
 58
58 -
 59
59 -
 60
60 -
 61
61 -
 62
62 -
 63
63 -
 64
64 -
 65
65 -
66
-
67
-
68
-
69
-
70
-
71
-
72
-
73
-
74
-
75
-
76
-
77
-
78
-
79
-
80
-
81
-
82
-
83
-
84
-
85
-
86
-
87
-
88
-
89
-
90
-
91
-
92
-
93
-
94
-
95
-
96
-
97
-
98
-
99
-
100
-
101
-
102
-
103
-
104
-
105
-
106
-
107
-
108
-
109
-
110
-
111
-
112
-
113
-
114
-
115
-
116
-
117
-
118
-
119
-
120
-
121
-
122
-
123
-
124
-
125
-
126
-
127
-
128
-
129
-
130
-
131
-
132
-
133
-
134
-
135
-
136
-
137
-
138
-
139
-
140
-
141
-
142
-
143
-
144
-
145
-
146
-
147
-
148
-
149
-
150
-
151
-
152
-
153
-
154
-
155
-
156
-
157
-
158
-
159
-
160
-
161
-
162
-
163
-
164
-
165
-
166
-
167
-
168
-
169
-
170
-
171
-
172
-
173
-
174
-
175
-
176
-
177
-
178
-
179
-
180
 |
 |

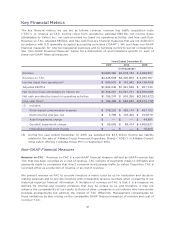
decline for the year ended December 31, 2014 was primarily attributable to a decline in advertising
revenue on Yahoo Properties in the Americas, EMEA, and Asia Pacific segments of $36 million, $8
million, and $26 million, respectively, and a decline in advertising revenue on Affiliate sites in the
EMEA segment of $15 million, partially offset by an increase in advertising revenue on Affiliate sites in
the Asia Pacific segment of $3 million.
Other Revenue
Other revenue includes listings-based services revenue, transaction revenue, royalties, patent licenses
and fees revenue. Listings-based services revenue is generated from a variety of consumer and
business listings-based services, including classified advertising, such as Yahoo Local and other
services. We recognize listings-based services revenue when the services are performed. Transaction
revenue is generated from facilitating commercial transactions through Yahoo Properties, principally
from Yahoo Small Business, Yahoo Travel, and Yahoo Shopping. We recognize transaction revenue
when there is evidence that qualifying transactions have occurred. We also receive royalties from
Yahoo Japan that are recognized when earned. We received royalties from Alibaba Group through
the third quarter of 2015 that were recognized when earned. See Note 8—“Investments in Equity
Interests Accounted for Using the Equity Method of Accounting” in the Notes to our consolidated
financial statements for additional information on revenue earned from Yahoo Japan and Alibaba
Group. Fees revenue consists of revenue generated from a variety of consumer and business fee-
based services as well as services for small businesses. We recognize fees revenue when the services
are performed.
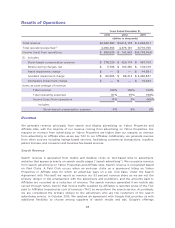
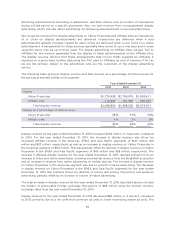
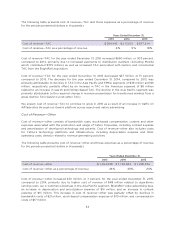
The following table presents other revenue and that revenue as a percentage of total revenue for the
periods presented (dollars in thousands):
Years Ended December 31,
2013 2014 2015
Other revenue
$ 988,759 $ 957,237 $ 810,001
Other revenue as a percentage of total revenue
21% 21% 16%
Other revenue for the year ended December 31, 2015 decreased $147 million, or 15 percent, compared
to 2014, primarily attributable to a decline in fees and listings-based revenue of $79 million and $69
million, respectively. The decline in fees revenue was primarily attributable to a decline in Alibaba
Group royalty revenue pursuant to the TIPLA, for which we ceased recognizing fees revenue in
September 2014 due to the Alibaba Group IPO. The decline in listings-based revenue was attributable
to a decline in auction and exchange fees, shopping traffic, and expiration of a partner agreement.
The decline in fees and listings-based revenue was also attributable to declines in Yahoo Small
Business associated with a reduction in its subscriber base.
The decline in other revenue for the year ended December 31, 2015 described above included the
impact of unfavorable foreign exchange fluctuations of $10 million using the foreign currency
exchange rates from the year ended December 31, 2014.
Other revenue for the year ended December 31, 2014 decreased $32 million, or 3 percent, compared
to 2013. The decrease for the year ended December 31, 2014 was primarily attributable to a decline in
listings-based revenue in the Americas, EMEA and Asia Pacific segments of $47 million, $15 million,
and $6 million, respectively, partially offset by an increase in fees revenue in the Americas segment of
$37 million. The increase in fees revenue in the Americas segment for the year ended December 31,
51